Bitcoin SV Price Analysis – August 02
In case the bullish momentum push up the price to break up $148 level, the key resistance level at $185 may be tested and a further increase may increase the price to $217. A bearish opposition at $148 level may send the price to the support level of $101 and it may reduce the price to the support level of $73 and $41
Key Levels:
Resistance levels: $148, $185, $217
Support levels: $101, $73, $41
BSV/USD Long-term Trend: Bullish
Bitcoin SV is bullish on the daily chart. The price action on the daily chart has formed a double bottom chart pattern. The price tested the support level at $101 second time on July 20. A bullish engulfing candle formed and the price increases towards the resistance level of $148. The Bitcoin SV is currently testing the resistance level of $148 in which it may be broken upside as the bulls increase their momentum.
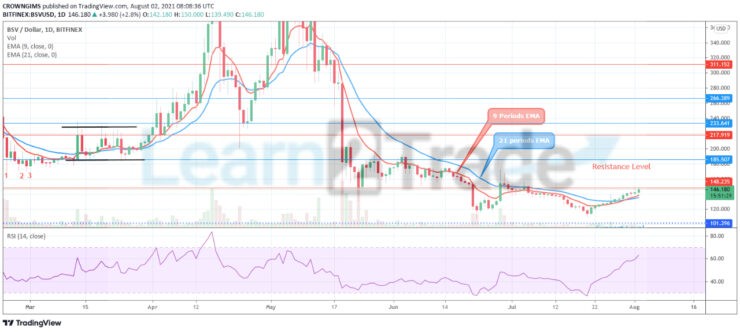
At the moment, the price action is producing bullish engulfing candle. The price is trading above the 9 periods EMA and 21 periods EMA on the daily chart. In case the bullish momentum push up the price to break up $148 level, the key resistance level at $185 may be tested and a further increase may increase the price to $217. A bearish opposition at $148 level may send the price to the support level of $101 and it may reduce the price to the support level of $73 and $41. The Relative Strength Index (14) is at 60 levels with the signal line pointing up to indicate buy signal.
BSV/USD Medium-term Trend: Bullish
Bitcoin SV is bullish on the 4 hour chart. The buyers dominate Bitcoin SV market last week after the bears lose pressure at the support level of $101, and it increases toward the resistance level at $148 level. The price is currently testing the resistance level of $148.
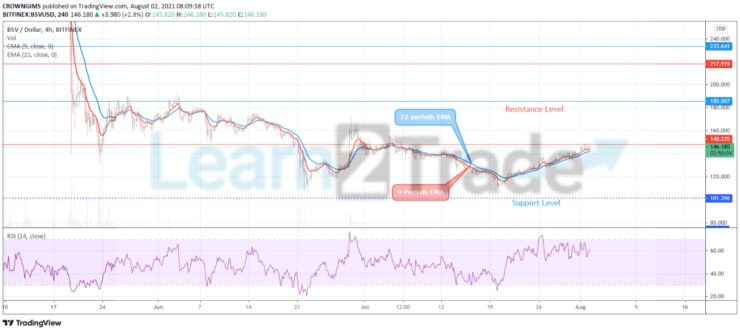
The price is trading above the 9 periods EMA and 21 periods EMA which indicate that bulls’ pressure is increasing. The relative strength period 14 is above 60 levels displaying strong bullish direction signal. You can purchase crypto coins here: Buy coins
- Broker
- Min Deposit
- Score
- Visit Broker

- Award-winning Cryptocurrency trading platform
- $100 minimum deposit,
- FCA & Cysec regulated

- 20% welcome bonus of upto $10,000
- Minimum deposit $100
- Verify your account before the bonus is credited
- Fund Moneta Markets account with a minimum of $250
- Opt in using the form to claim your 50% deposit bonus
Learn to Trade
Never Miss A Trade Again

Signal Notification
Real-time signal notifications whenever a signal is opened, closes or Updated

Get Alerts
Immediate alerts to your email and mobile phone.

Entry Price Levels
Entry price level for every signal Just choose one of our Top Brokers in the list above to get all this free.