

Bitcoin SV Price Analysis – February 22
A breakout is expected in the BSV market. The breakout at the resistance level of $259 will propel the price towards $311 -$364. In the same vein, the breakout at $217 will reduce the price to $179 and $153.
BSV/USD Market
Key Levels:
Resistance levels: $259, $311, $364
Support levels: $217, $179, $153
BSV/USD Long-term Trend: Ranging
BSV/USD market is ranging. Last two weeks the crypto was heading towards a $311 resistance level before it was interrupted by the bearish force. It fell back to the support level of $217 where the bears lose their momentum and could not break down the support level of $217. The bulls’ momentum is weak and could not break up the resistance level at $259. The coin is range-bound within the resistance level of $259 and the support level of $217.
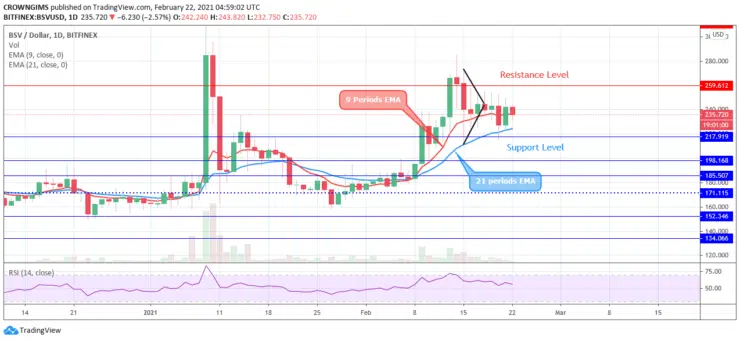
Ranging movement may continue as the market opens today with the bearish candle with low momentum. Bitcoin SV market is trading in between the 9 periods EMA and 21 periods EMA which indicates that ranging movement is ongoing in the BSV market. A breakout is expected in the BSV market. The breakout at the resistance level of $259 will propel the price towards $311 -$364. In the same vein, the breakout at $217 will reduce the price to $179 and $153.
BSV/USD Medium-term Trend: Ranging
On the medium-term outlook, Bitcoin SV is in the ranging mode. The crypto formed a symmetrical triangle last week and the price breakout bearishly but with low momentum. That is why there was no significant movement within the market. Low momentum from the bears and the bulls leads to ranging movement. BSV market awaiting a breakout.

The two EMAs are interlocked to each other and the price is trading over and around the EMAs which confirms that consolidation is in progress. The relative strength index is displaying a bearish signal at the 50 levels which indicates that there could be a bearish breakout.


