Bitcoin SV Price Analysis – October 18
When the bears increase their momentum, it may break down the support level at $148 level and decrease to $112 and $73 price level. Inability to break down the $148 price level may lead to an increase in price to the resistance levels at 4193, $233 and $266.
Key Levels:
Resistance levels: $193, $233, $266
Support levels: $148, $112, $73
BSV/USD Long-term Trend: Bullish
On the daily chart, Bitcoin SV is bullish. The bulls started to dominate the market on September 29. The bullish momentum increased and broke up the former resistance level of $148. It was extending towards the resistance level of $193 last week. The price is currently pulling back towards below the dynamic support level.
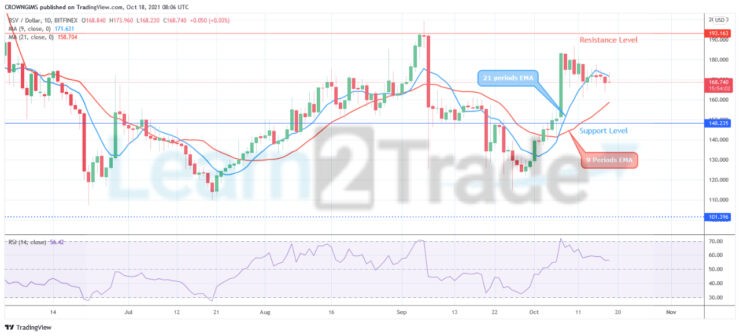
Bitcoin SV is penetrating the dynamic support levels; it is trading below the 9 periods EMA and it is trying to penetrate 21 periods EMA on the daily chart, also the fast moving EMA remains above the slow moving EMA as a bullish movement indication. When the bears increase their momentum, it may break down the support level at $148 level and decrease to $112 and $73 price level. Inability to break down the $148 price level may lead to an increase in price to the resistance levels at 4193, $233 and $266.
BSV/USD Medium-term Trend: Bearish
Bitcoin SV is bearish on the 4 hour chart. The Crypto was bullish last week and the price was increasing slowly towards the resistance level of $193. It has not reach the mark before it was interrupted by the bears. The price decline with slow progress but the sellers lose momentum along the way and it started to consolidate.
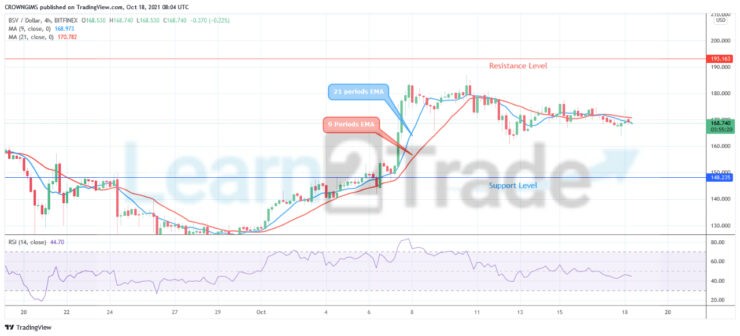
The two EMAs are interlocked to each other and the price is trading around the 9 periods EMA and 21 periods EMA as a sign of consolidating market. The relative strength index period 14 is at 50 levels displaying no specific signal direction.
You can purchase crypto coins here: Buy coins
- Broker
- Min Deposit
- Score
- Visit Broker

- Award-winning Cryptocurrency trading platform
- $100 minimum deposit,
- FCA & Cysec regulated

- 20% welcome bonus of upto $10,000
- Minimum deposit $100
- Verify your account before the bonus is credited
- Fund Moneta Markets account with a minimum of $250
- Opt in using the form to claim your 50% deposit bonus
Learn to Trade
Never Miss A Trade Again

Signal Notification
Real-time signal notifications whenever a signal is opened, closes or Updated

Get Alerts
Immediate alerts to your email and mobile phone.

Entry Price Levels
Entry price level for every signal Just choose one of our Top Brokers in the list above to get all this free.