Bitcoin SV Price Analysis – December 13
Further increase in the bears’ pressure will decrease the price to break down the support level of $113 which may expose the price to $73 and $41 price level. In case the support level of $133 holds, the price may increase towards the resistance level at $148, $171 and $194.
Key Levels:
Resistance levels: $148, $171, $194
Support levels: $113, $73, $41
BSV/USD Long-term Trend: Bearish
On the daily chart, Bitcoin SV is bearish. Last two weeks, the coin was on the bullish movement in the daily chart. The resistance level $171 was tested when the price pulled back from $113 support level. The bears opposed the price increase and long tailed daily candle formed. Follow the scenario is the formation of bearish engulfing candle which triggered a bearish trend. The price is currently facing $113 price level.
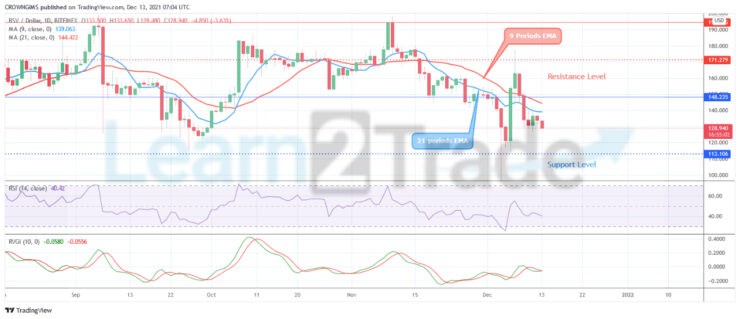
The two EMAs are bending down to follow the direction of the price. The crypto continue its trading below the 9 periods EMA and the 21 periods EMA which indicate bearish momentum. Further increase in the bears’ pressure will decrease the price to break down the support level of $113 which may expose the price to $73 and $41 price level. In case the support level of $133 holds, the price may increase towards the resistance level at $148, $171 and $194.
BSV/USD Medium-term Trend: Bearish
Bitcoin SV is on the bearish movement on the medium-term outlook. The bears eventually dominates the Bitcoin SV market. The momentum of the bears increase and the price decline to break down the support level at $148. The price is decreasing towards the support level of $133.
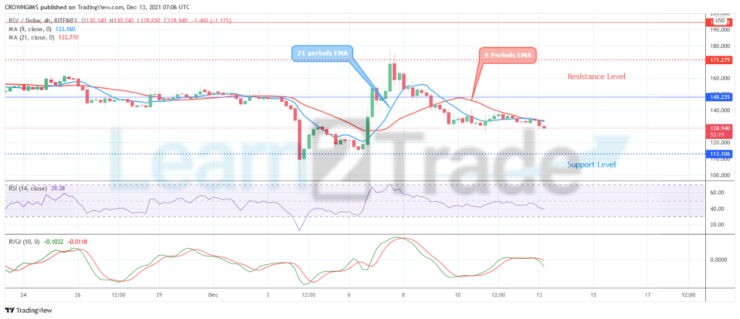
The price is trading below the 9 periods EMA and 21 periods EMA which indicate that bears are in control of the market. The relative strength index period 14 is at 40 levels displaying a bearish signal.
You can purchase crypto coins here. Buy Tokens
- Broker
- Min Deposit
- Score
- Visit Broker

- Award-winning Cryptocurrency trading platform
- $100 minimum deposit,
- FCA & Cysec regulated

- 20% welcome bonus of upto $10,000
- Minimum deposit $100
- Verify your account before the bonus is credited
- Fund Moneta Markets account with a minimum of $250
- Opt in using the form to claim your 50% deposit bonus
Learn to Trade
Never Miss A Trade Again

Signal Notification
Real-time signal notifications whenever a signal is opened, closes or Updated

Get Alerts
Immediate alerts to your email and mobile phone.

Entry Price Levels
Entry price level for every signal Just choose one of our Top Brokers in the list above to get all this free.