

Bitcoin SV Price Analysis – May 24
Further increase in the bears’ pressure may push down the price below the $152 level, then, there will be a price decrease towards the support level of $134 and $115. In case the bears’ momentum fails at $152, the price may increase towards the resistance levels at $171, $198 and $217. BSV/USD Market
Key Levels:
Resistance levels: $171, $198, $217
Support levels: $152, $134, $115
BSV/USD Long-term Trend: Bearish
Bitcoin SV is Bearish on the daily chart. The double top chart pattern formed two weeks ago on the daily chart triggered the declination of the Bitcoin SV price. The price has broken down the former support levels of $217, $198 and $171. The bearish momentum increases and the price has decreased to the support level at $134. Today, the bulls open Bitcoin SV market and the price is pulling back.
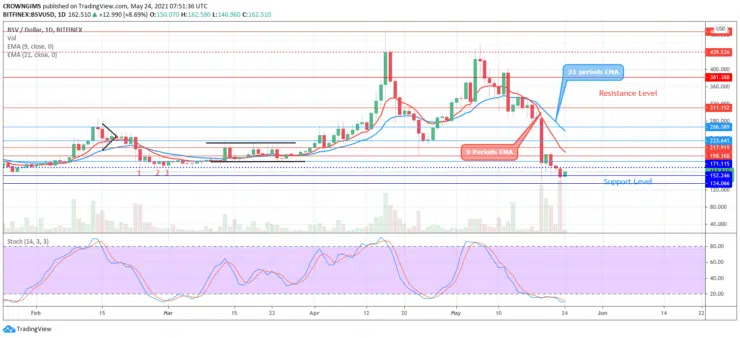
The price continues its trading below the 9 periods EMA and the 21 periods EMA as a sign of increase in bearish momentum. Further increase in the bears’ pressure may push down the price below the $152 level, then, there will be a price decrease towards the support level of $134 and $115. In case the bears’ momentum fails at $152, the price may increase towards the resistance levels at $171, $198 and $217.
BSV/USD Medium-term Trend: Bearish
Bitcoin SV is bearish on the medium-term outlook. The price continue to decrease as the bearish momentum increases in the BSV market. After the breakout from the ranging movement within the $381 and $311 price level, the bears gained more pressure and a big bearish candle formed that breaks down the support level of $311. Since then, the bears hold tight to the BSV market.

The price is trading below the 9 periods EMA and 21 periods EMA which indicate an increase in bearish movement. The Stochastic Oscillator period 14 is displaying a bullish signal above 30 levels which indicates buy signal and it may be a pullback.


