Also, it has been observed that more than $4 billion have exited the market in the past 24 hours, which is a sign of heavy ‘profit-taking’ by traders.
Many have even gone as far as suggesting that the Bitcoin bull run is coming to an end.

Bitcoin Price Levels to Watch
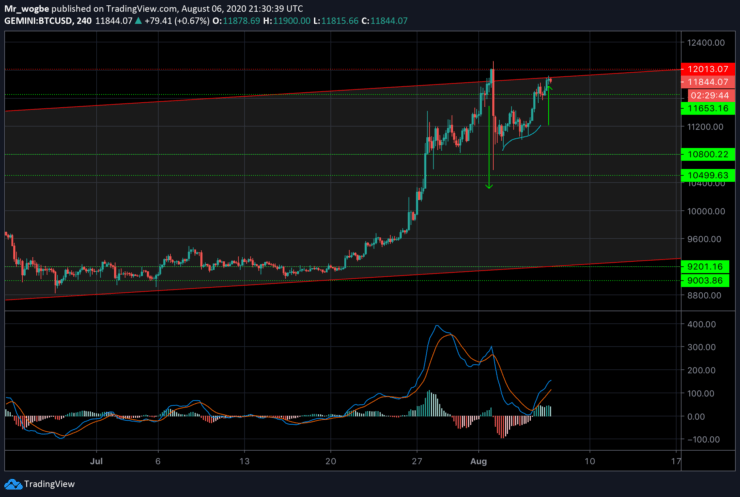
On the 4-hour BTC/USD chart, it can be observed that the “whale pattern” talked about in a previous analysis, has now played out completely. As explained previously, a sideways movement is always expected to be seen whenever this pattern emerges.
That said, BTC could experience a modest retrace to the $11,370 region in the short-term where a bounce to the $12,000 target is expected to take place.
However, failure to bounce off that level could precipitate further declines and could send BTC to the $11,170 and subsequently the $11,070 levels. The furthest BTC is expected to reach in this retrace is the $10,800 region, a sustained drop below that level could overhaul the current favorable sentiment.
At press time, BTC is currently faced with the top of our ascending channel around $11,800. A clean break from that level could usher-in $12,000 immediately.
Total Market Capital: $359.2 billion
Bitcoin Market Capital: $219 billion
Bitcoin Dominance: 60.1%
Note: Learn2.trade is not a financial advisor. Do your research before investing your funds in any financial asset or presented product or event. We are not responsible for your investing results
- Broker
- Min Deposit
- Score
- Visit Broker
- Award-winning Cryptocurrency trading platform
- $100 minimum deposit,
- FCA & Cysec regulated
- 20% welcome bonus of upto $10,000
- Minimum deposit $100
- Verify your account before the bonus is credited
- Fund Moneta Markets account with a minimum of $250
- Opt in using the form to claim your 50% deposit bonus
Learn to Trade
Never Miss A Trade Again

Signal Notification
Real-time signal notifications whenever a signal is opened, closes or Updated

Get Alerts
Immediate alerts to your email and mobile phone.

Entry Price Levels
Entry price level for every signal Just choose one of our Top Brokers in the list above to get all this free.


