• The bullish trend remains valid but Bitcoin needs to close well above $7000 to start a fresh rally
• Bitcoin is forming a bullish setup in an hourly channel
• Bitcoin is holding weekly support at $5880
After making a false breakout yesterday, Bitcoin’s price dropped and continued to hold strongly around a controversial resistance of $6900; which held bullish actions for the past weeks. For this reason, Bitcoin is now priced at $6929 against the US Dollar. Although the price is still up by 4.39% to indicate that buyers are still in the market.
Key resistance levels: $7200, $7600, $8000
Key support levels: $6600, $6170, $5880
Bitcoin (BTC) Price Analysis: 4H Chart – Bullish
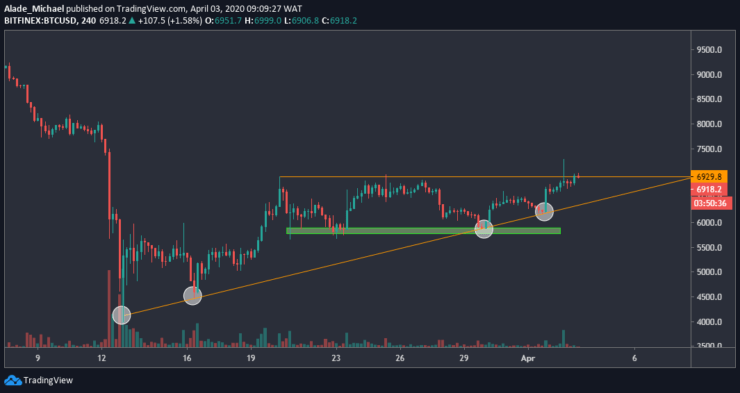
Yesterday, Bitcoin broke out from an ascending triangle after series of push from the $4000. But the triangle breakout became invalid after a quick rejection from $7200 (trapping some buyers) to $6900 at the moment. Notwithstanding, the setup is still looking bullish on the 4-hours chart.

If the buyers increase pressure one more time, Bitcoin is likely to test $7200 resistance (yesterday’s high). A push above this resistance should propel buying to $7600 and possibly $8000 in the coming days. An inverse move could send BTC to $6600 and $6170 support, slightly below the triangle. Below this support lies $5880, marked green on the chart.
Bitcoin (BTC) Price Analysis: Hourly Chart – Bullish
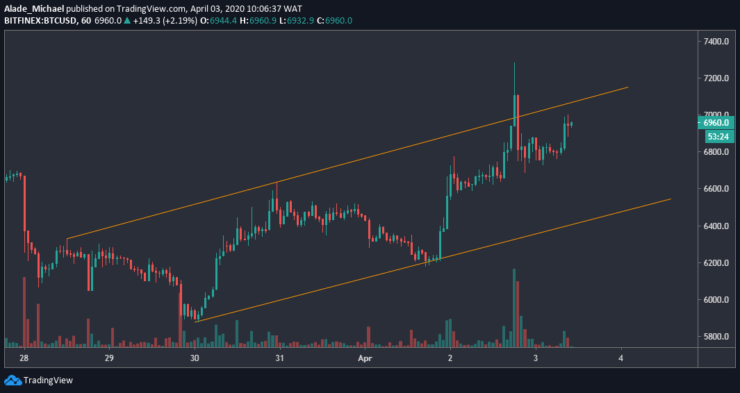
The hourly chart for Bitcoin shows that the price is respecting an ascending channel pattern. As can be seen, the recent channel breakout to $7200 turned out to be a fake-out. Bitcoin is now trading back inside the channel. As it appeared now, the price is likely to drop soon as Bitcoin struggles below $7000 resistance level.

There’s close support at $6800 in case Bitcoin shows weakness. The next support can be located at $6600, around the lower boundary of the channel. If this boundary fails to act as support, Bitcoin may break down to $6200 and $5880 support.
BITCOIN SELL ORDER
Sell: $6933
TP: $6612
SL: $7177
- Broker
- Min Deposit
- Score
- Visit Broker
- Award-winning Cryptocurrency trading platform
- $100 minimum deposit,
- FCA & Cysec regulated
- 20% welcome bonus of upto $10,000
- Minimum deposit $100
- Verify your account before the bonus is credited
- Fund Moneta Markets account with a minimum of $250
- Opt in using the form to claim your 50% deposit bonus
Learn to Trade
Never Miss A Trade Again

Signal Notification
Real-time signal notifications whenever a signal is opened, closes or Updated

Get Alerts
Immediate alerts to your email and mobile phone.

Entry Price Levels
Entry price level for every signal Just choose one of our Top Brokers in the list above to get all this free.


