• Despite that, Bitcoin remains bullish inside a channel on the daily chart
Over the past weekend, Bitcoin saw a huge price movement to the downside after marking a 4-month high around $10500. The $10000 breakdown has led to a serious selling pressure which amounted to 6% losses over the past days.
Bitcoin is now trading around $9700 support. If this support fails to provide a rebound, the next correction may reach $9200.
Key resistance levels: $10000, $10400, $11000
Key support levels: $9600, $9200, $8300
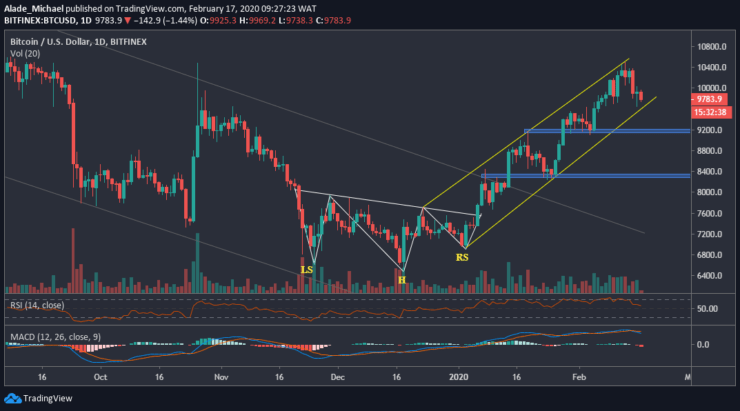
Bitcoin (BTC) Price Analysis: Daily Chart – Bullish
Following the latest price drops, Bitcoin’s bullish setup looks valid on the daily chart. The $700 price cut has led the price to the channel’s support around $9700. This support is a crucial area to determine whether the price will hold or not. As shown on the technical indicators, the bears are still showing interest in the market.

If Bitcoin breaks down this rising channel, the bearish scenario could become stronger as $9200 and $8300 support would be the next selling target.
Meanwhile, a strong rebound from the current support level could trigger a huge buying pressure at $10000 resistance within a blink of an eye. A climb above this resistance should send us back at $10400 and $11000 in the next rally.
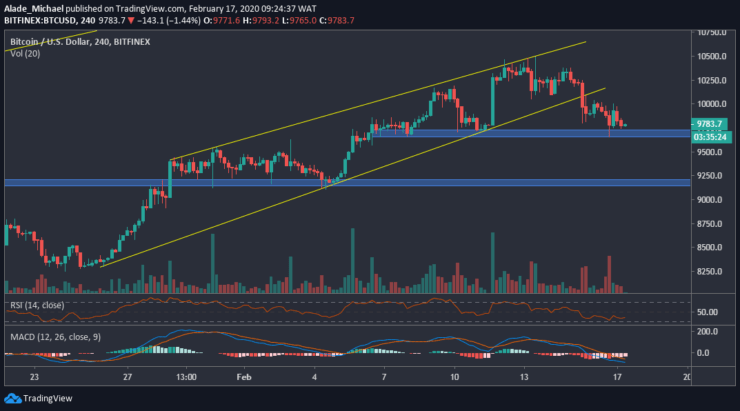
Bitcoin (BTC) Price Analysis: 4H Chart – Bearish
In our previous crypto trading signals, we mentioned the possible bearish move to $9700 which eventually played out after breaking down from a three-week wedge over the weekend. Bitcoin’s bears are looking for lower levels, but still struggling with the $9700 support over the past few hours.

If the bears successful over this mentioned support, the next key support to watch is the blue zone of $9200; although they may encounter close support around $9400. On the other hand, Bitcoin may resume bullish if $9700 holds.
The resistance here is $10000, $10200 and $10400. We can see that the technical RSI and MACD are down to suggest that sellers are still present. We can expect a bullish move as soon as these indicators turn positive.
BITCOIN BUY ORDER
Buy: $9791
TP: $9977
SL: $9685
- Broker
- Min Deposit
- Score
- Visit Broker
- Award-winning Cryptocurrency trading platform
- $100 minimum deposit,
- FCA & Cysec regulated
- 20% welcome bonus of upto $10,000
- Minimum deposit $100
- Verify your account before the bonus is credited
- Fund Moneta Markets account with a minimum of $250
- Opt in using the form to claim your 50% deposit bonus
Learn to Trade
Never Miss A Trade Again

Signal Notification
Real-time signal notifications whenever a signal is opened, closes or Updated

Get Alerts
Immediate alerts to your email and mobile phone.

Entry Price Levels
Entry price level for every signal Just choose one of our Top Brokers in the list above to get all this free.


