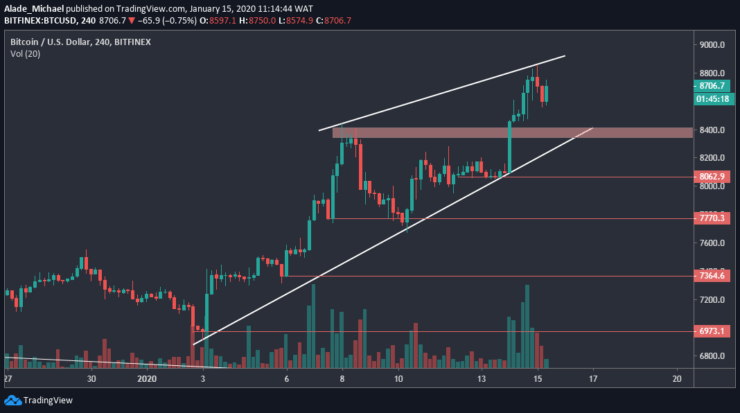
• A heavy drop could occur if BTC breaks the wedge on the 4H chart.
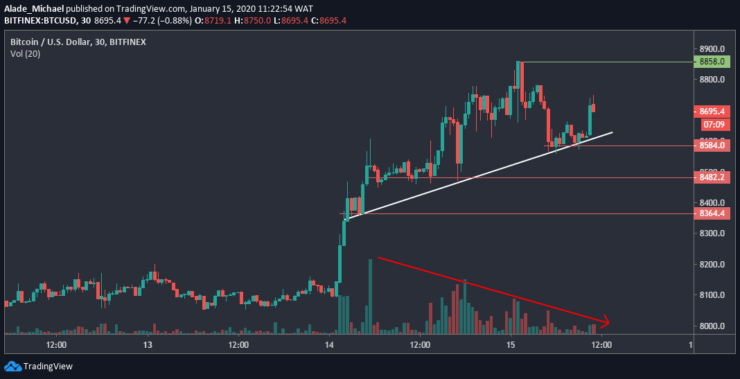
• Decreasing volume on the 30-M chart indicates short selling for Bitcoin.
After our previous crypto trading signals, Bitcoin’s price shifted a bit upward to $8800 before closing around $8770 yesterday. Today, the market has dropped slightly $8600 after opening long at $8850. However, Bitcoin is now priced at $8700. If the price surges above the current high, we can anticipate more gains. Otherwise, the market could fall back to $8400.
Key resistance levels: $8858, $9000
Key support levels: $8400, $8000
Bitcoin (BTC) Price Analysis: 4H Chart – Bullish
Since Bitcoin broke $8400 to $8850 yesterday, the price has remained trapped in a rising wedge. As of now, BTC is likely to fall into the wedge’s support of $8400 – where the red horizontal area lies. But one thing here is that the bullish pattern has stretched enough in the wedge as a breakout is imminent.

If Bitcoin’s price drops below this wedge, $8000 would be the next selling target. A further drop could cut the BTC price to $7770, $7364 and $7000 support. But at the moment, the most realistic level here is $8400 – where the market could bounce back to $9000. However, a wedge breakup would strengthen more bullish actions.
Bitcoin (BTC) Price Analysis: 30M Chart – Bullish
Bitcoin’s momentum has been quite weak since the price crossed $8400 yesterday. Following a small drop earlier today, Bitcoin is currently bouncing back after finding support around the $8580 and at the same time sitting on the white diagonal support. Buyers are now targeting previous resistance of $8850.

New resistance could be created around $9000 if Bitcoin breaks the current resistance. Looking at the 30-minutes chart, we can see that volume is on the downside – suggesting a potential drop in price. Should BTC show weakness and plunges below $8500, we should expect a quick correction to $8400. A further drop beneath this mentioned price might lead to a devastating drop.
BITCOIN BUY SIGNAL
Buy Entry: $8704
TP: $8800
SL: $8500
- Broker
- Min Deposit
- Score
- Visit Broker
- Award-winning Cryptocurrency trading platform
- $100 minimum deposit,
- FCA & Cysec regulated
- 20% welcome bonus of upto $10,000
- Minimum deposit $100
- Verify your account before the bonus is credited
- Fund Moneta Markets account with a minimum of $250
- Opt in using the form to claim your 50% deposit bonus
Learn to Trade
Never Miss A Trade Again

Signal Notification
Real-time signal notifications whenever a signal is opened, closes or Updated

Get Alerts
Immediate alerts to your email and mobile phone.

Entry Price Levels
Entry price level for every signal Just choose one of our Top Brokers in the list above to get all this free.


