• $7600-$8000 support provides a rebound for Bitcoin.
• A retracement move is likely if the price drops below $8500
After finding support at $7600 last week, Bitcoin has further mounted key support at $8000 -which now fuels the current price increase. The buyers are coming up with a strong momentum that is likely to turn the BTC market on bullish impulsive for this year. If the bears react to price actions, we should expect a retracement move to a near or an important support level.
Key resistance levels: $8800, $9600
Key support levels: $8000, $7600
Bitcoin (BTC) Price Analysis: Daily Chart – Bullish
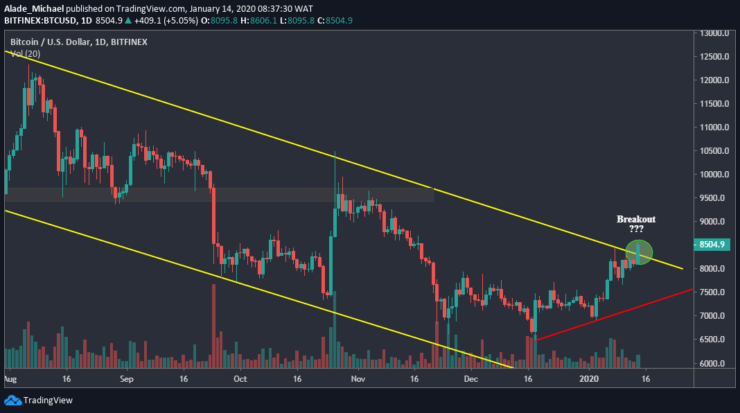
Bitcoin is attempting to break away from a six-month descending channel. The bullish move would confirm if we see a daily price close above this channel. As of now Bitcoin has managed to surpass last week’s $8400 and now trading slightly above $8500. The last 24-hours gain from $8000 signals an incoming bullish momentum.
A clean breakout should provide buying opportunity to June 2019 high ($13700) in coming months.

But for now, the mid-term resistance lies at $8800 and $9600. Meanwhile, Bitcoin is currently sitting on $8000 support. If this support fails to keep the bulls on track, BTC may have support at $7600. Following the past four weeks of gains, Bitcoin’s price would keep appreciating if buyers stay long in the market.
Bitcoin (BTC) Price Analysis: Hourly Chart – Bullish
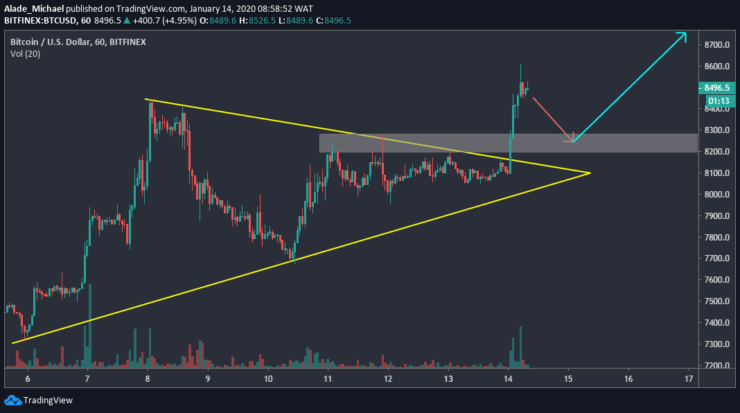
The latest surge above the yellow symmetrical triangle on the hourly chart indicates that the bulls are back in the market. Meanwhile, Bitcoin’s price has been rejected at $8600. A retracement is likely to play out before BTC continues to climb higher. The potential rebound level here is $8288 – where the horizontal grey area lies on the chart.

From this area, the next buying target we should be looking at is $8800 and $9000. At the moment, the market is deciding on whether to drop or not. If the bulls regroup above $8500, Bitcoin could significantly surge to the mentioned resistance. However, it’s important to wait for a short pullback before joining the bullish trend.
BITCOIN BUY SIGNAL
Buy Entry: $8289
TP: $8600 / $8800
SL: $8022
- Broker
- Min Deposit
- Score
- Visit Broker
- Award-winning Cryptocurrency trading platform
- $100 minimum deposit,
- FCA & Cysec regulated
- 20% welcome bonus of upto $10,000
- Minimum deposit $100
- Verify your account before the bonus is credited
- Fund Moneta Markets account with a minimum of $250
- Opt in using the form to claim your 50% deposit bonus
Learn to Trade
Never Miss A Trade Again

Signal Notification
Real-time signal notifications whenever a signal is opened, closes or Updated

Get Alerts
Immediate alerts to your email and mobile phone.

Entry Price Levels
Entry price level for every signal Just choose one of our Top Brokers in the list above to get all this free.


