• If the bullish flag pattern fails, Bitcoin may roll back to $7100
After a quick bounce from $7072, Bitcoin keeps finding it difficult to push the price above the current weekly high of $7450. Despite that, Bitcoin is still looking bullish across major time frames. Though BTC dominance has dropped a bit to 63.9% over the last 24-hours. We can expect a sharp surge once Bitcoin decides on the next move. As of now, Bitcoin is trading at $7311 against the US Dollar.
Key resistance levels: $7450, $7600
Key support levels: $7072, $6700
Bitcoin (BTC) Price Analysis: 4H Chart – Bullish
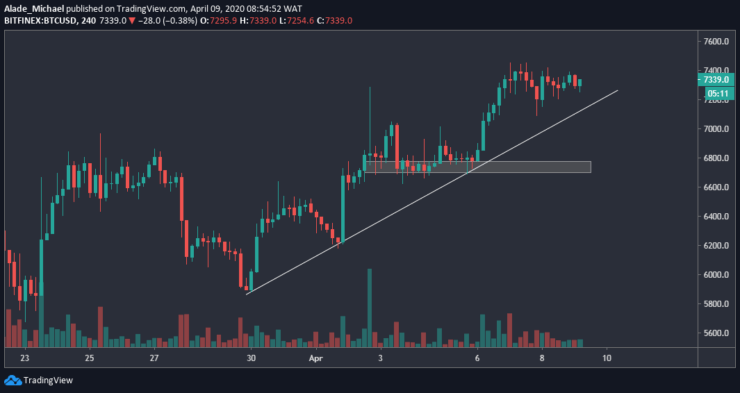
Bitcoin is still following a bullish trend but the market is currently under a consolidation mode over the past 48-hours. A sudden price movement should be expected if Bitcoin’s volatility expands. At the same time, the trading volume is suggested low on the 4-hours chart.

In case Bitcoin resumes buying pressure, the area of value to keep in mind is $7450 resistance – April 6 high. A push above this resistance should validate more rallies to around $7600. But if the price drops, there’s close support at $7072 (yesterday’s low). A drop beneath the white rising trend line could trigger a huge selling pressure to $6700 support, marked grey on the chart.
Bitcoin (BTC) Price Analysis: Hourly Chart – Bullish
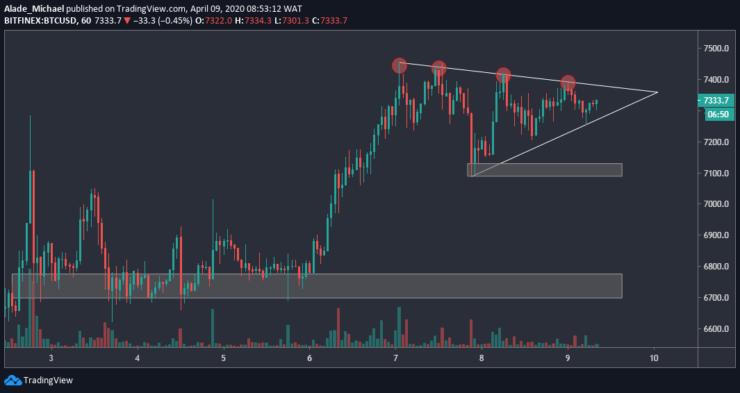
Bitcoin is gearing for another major move on the hourly chart. As we can see from above, Bitcoin faced multiple rejections (circled red on the price chart) since the price surged to $7450 earlier this week. From below, Bitcoin has at the same time rebounded at $7100, $7200 and $7250 levels a few hours ago.

Following this price movement, Bitcoin’s volatility is now shrinking near the apex of the symmetrical triangle, which suggests a potential breakout. Above the triangle, Bitcoin is likely to create fresh resistance at around $7500 and $7600. Below the triangle, the key support to watch is $7100, right in the first grey box. Bitcoin could dump to the second grey box at $6700 if the price further breaks down.
BITCOIN BUY ORDER
Buy: $7300
TP: $7600
SL: $7210
- Broker
- Min Deposit
- Score
- Visit Broker
- Award-winning Cryptocurrency trading platform
- $100 minimum deposit,
- FCA & Cysec regulated
- 20% welcome bonus of upto $10,000
- Minimum deposit $100
- Verify your account before the bonus is credited
- Fund Moneta Markets account with a minimum of $250
- Opt in using the form to claim your 50% deposit bonus
Learn to Trade
Never Miss A Trade Again

Signal Notification
Real-time signal notifications whenever a signal is opened, closes or Updated

Get Alerts
Immediate alerts to your email and mobile phone.

Entry Price Levels
Entry price level for every signal Just choose one of our Top Brokers in the list above to get all this free.


