• Despite indecisiveness, Bitcoin could foot more bearish correction.
• Bitcoin now held resistance at $8800 over the last 48-hours trading.
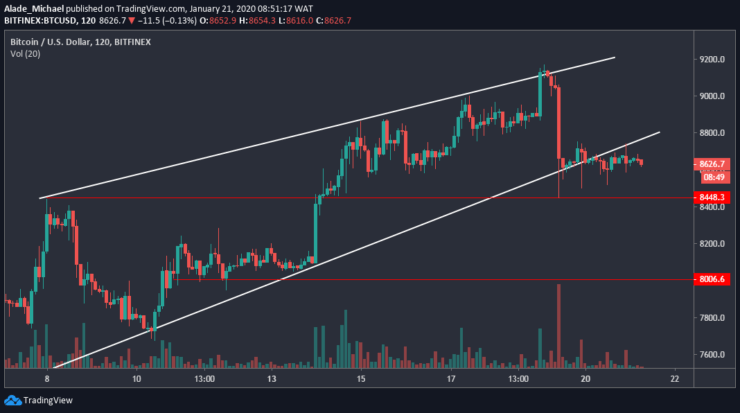
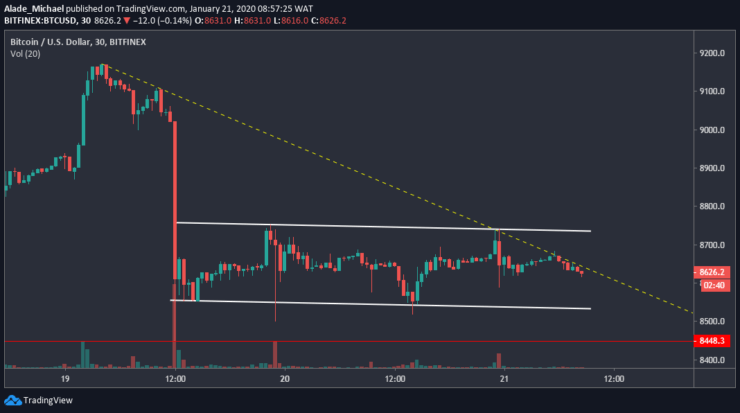
Since Bitcoin fell from $9150 over the weekend, the price has continued to hover around $8600. Due to the sideways swing on the 30-minutes chart, BTC has stylishly moved out of the wedge that is forming on the 2-hours chart. However, the scenario may become uglier if Bitcoin drops below the current holding support.
Key resistance levels: $8800, $9000
Key support levels: $8450, $8000
Bitcoin (BTC) Price Analysis: 2H Chart – Bearish
On the 2-hours chart, Bitcoin has slightly left the wedge pattern following a dramatic consolidation over the last two days. Currently, BTC volatility is subdued with choppy price actions. In case we see another bearish surge, the market may revisit the $8450 support. It might even reach $8000 if the surge becomes heavy.

But as it appeared now, Bitcoin’s price is still indecisive. On the other hand, buyers may step back in the market to reiterate setup. If they can regroup well above $8800 resistance, it would be easier to reclaim $9000 resistance. With the current market condition, there’s no sign of interest amongst traders for a while. The future trading will tell which way is next for Bitcoin.
Bitcoin (BTC) Price Analysis: 30M Chart – Neutral
On the 30-minutes time frame, we can see that Bitcoin is following a sideways trend. Most importantly, the price action is captured in a channel boundary – acting as support and resistance over the past few days. Also, the market is respecting the yellow-dotted trend line that was formed from January 19 high.

Bitcoin is trapped but we can expect major move once the price breakout of the channel boundary. A break above the channel would take us back to $8900 and $9100 resistance. A break below the channel could lead Bitcoin straight to $8500 before advancing to $8200 support.
For now, Bitcoin’s price is at equilibrium. We may need to wait for a clear break before initiating an entry.
- Broker
- Min Deposit
- Score
- Visit Broker
- Award-winning Cryptocurrency trading platform
- $100 minimum deposit,
- FCA & Cysec regulated
- 20% welcome bonus of upto $10,000
- Minimum deposit $100
- Verify your account before the bonus is credited
- Fund Moneta Markets account with a minimum of $250
- Opt in using the form to claim your 50% deposit bonus
Learn to Trade
Never Miss A Trade Again

Signal Notification
Real-time signal notifications whenever a signal is opened, closes or Updated

Get Alerts
Immediate alerts to your email and mobile phone.

Entry Price Levels
Entry price level for every signal Just choose one of our Top Brokers in the list above to get all this free.


