• If Bitcoin fails to regain momentum at $10200-$10000 support area; a bearish correction could occur.
Over the last 24-hours, Bitcoin’s price has remained under $10500 after seeing about 8% increases this week. The price increase made Bitcoin to mark a fresh yearly high at around $10450, but the level has proven difficult for the bulls to surpass. Following a current rejection, Bitcoin is now retracing to $10200-$10000 support. If this area fails to provide a rebound, Bitcoin may go bearish on a short-term.
Key resistance levels: $10600, $10800
Key support levels: $10000, $9700
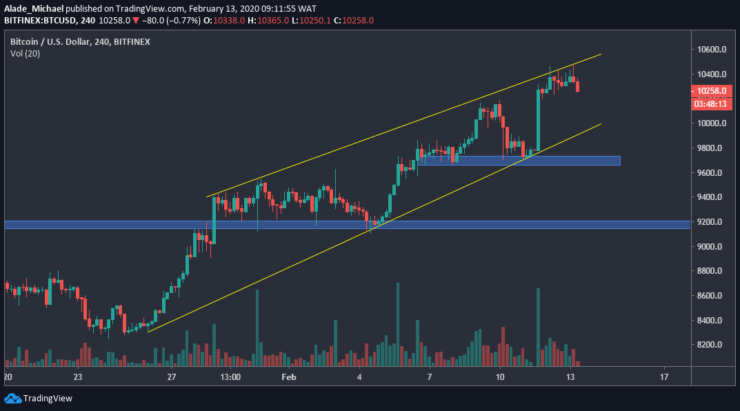
Bitcoin (BTC) Price Analysis: 4H Chart – Bullish
After bouncing back from $9700 this week, Bitcoin continues to trade inside a two week rising wedge. But this time, the market is providing a discount for buyers again. The retracement area to look out for is $10000, around the wedge’s lower boundary. Meanwhile, this wedge pattern is almost reaching a breakpoint on the 4-hours chart.

If Bitcoin’s price slumps beneath this wedge, the immediate support to watch out for is $9700, where BTC recently bounced from. Breaking this weekly support could lead us to a temporal bearish swing. However, if BTC tried to regain momentum above $10000, the next level of resistance to watch is $10600 and $10800. Still, Bitcoin needs to reclaim the current high of $10450 before advancing higher.
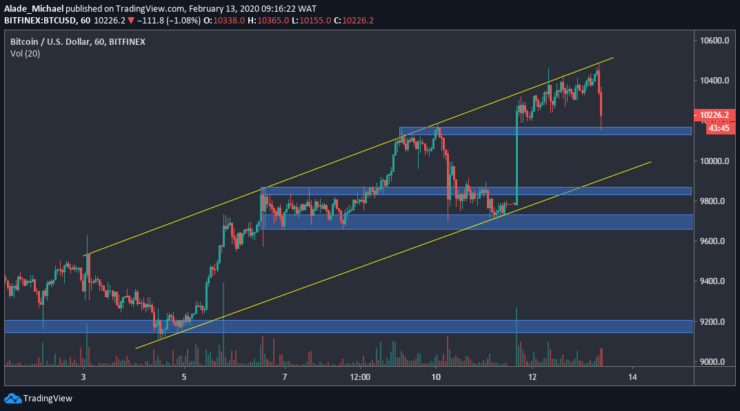
Bitcoin (BTC) Price Analysis: Hourly Chart – Bullish
On the hourly chart, Bitcoin nosedived after facing multiple rejections around the channel’s upper boundary. We can see that the market is heading for the channel’s lower boundary, but the market currently encountered minor support around $10200 – right on the first blue area on the chart.

In case the price keeps dropping, we can expect support at the channel’s lower boundary of $10000. A bearish extension could drop Bitcoin into the subsequent blue support area of 9850 and $9700. The scenario could get uglier if the market to fall. Currently, BTC holds resistance at $10450. If the price finds support around $10200 or $10000, the bullish sentiment is expected to reach $10600 in the next rally.
BITCOIN BUY ORDER
Buy: $10021
TP: $10400
SL: $9949
- Broker
- Min Deposit
- Score
- Visit Broker
- Award-winning Cryptocurrency trading platform
- $100 minimum deposit,
- FCA & Cysec regulated
- 20% welcome bonus of upto $10,000
- Minimum deposit $100
- Verify your account before the bonus is credited
- Fund Moneta Markets account with a minimum of $250
- Opt in using the form to claim your 50% deposit bonus
Learn to Trade
Never Miss A Trade Again

Signal Notification
Real-time signal notifications whenever a signal is opened, closes or Updated

Get Alerts
Immediate alerts to your email and mobile phone.

Entry Price Levels
Entry price level for every signal Just choose one of our Top Brokers in the list above to get all this free.


