• The price continues to hold above $7000 support as bullish continuation remains shaky
Last week, Bitcoin corrected to $6500 but managed to bounce back above $7000 level. Starting the week above this level could be an interesting bullish sign for Bitcoin.
But it might become worrisome if the price continues to struggle under $7450 resistance. Bitcoin is currently changing hands at around $7170. The recent correction might continue if the price slips beneath $7000.
Key resistance levels: $7300, $7450
Key support levels: $7000, $6800
Bitcoin (BTC) Price Analysis: 4H Chart – Bullish
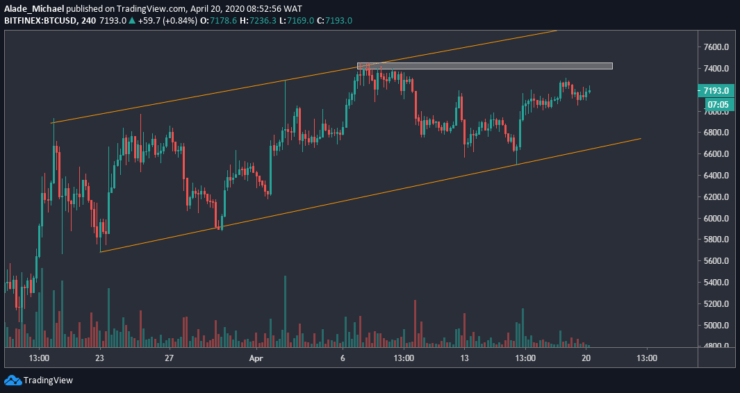
The April 16 bounce from $6500 has reactivated bullish sentiment for Bitcoin and at the same time captures the momentum in an ascending channel pattern. As can be seen on the price chart, Bitcoin is eyeing a crucial resistance of $7450 (marked grey) but buyers are facing tough resistance around $7200-$7300 for the past three days now.

Bitcoin is currently undergoing a slight consolidation. We can expect a nice rally to the upper boundary of the channel of buyers can push above this grey horizontal area. But if Bitcoin fails to regain momentum, a drop below $7000 could trigger a sell to $6800, which is around the channel’s support. The drops would become terrible if a channel breakdown occurs.
Bitcoin (BTC) Price Analysis: Hourly Chart – Bullish
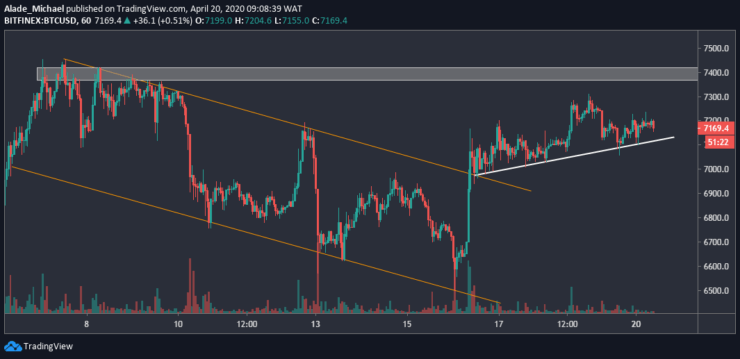
After breaking above a 10-day descending channel, Bitcoin reclaimed $7000 and continued to hold above it. Though the three days bullish action is now supported by a white rising trend line, as shown on the hourly chart. The price touched $7300 over the weekend but now dropping towards this rising line.

If Bitcoin plunges below this trend line, ugly selling pressure may reach $7000 support. It may even drop to $6900 and $6800 support if the supply keeps increasing, resulting in bearish again. On the upside, Bitcoin would need to surpass $7200 – $7300 price area before advancing higher to $7450 – the monthly high.
Note: Learn2Trade.com is not a financial advisor. Do your research before investing your funds in any financial asset or presented product or event. We are not responsible for your investing results
- Broker
- Min Deposit
- Score
- Visit Broker
- Award-winning Cryptocurrency trading platform
- $100 minimum deposit,
- FCA & Cysec regulated
- 20% welcome bonus of upto $10,000
- Minimum deposit $100
- Verify your account before the bonus is credited
- Fund Moneta Markets account with a minimum of $250
- Opt in using the form to claim your 50% deposit bonus
Learn to Trade
Never Miss A Trade Again

Signal Notification
Real-time signal notifications whenever a signal is opened, closes or Updated

Get Alerts
Immediate alerts to your email and mobile phone.

Entry Price Levels
Entry price level for every signal Just choose one of our Top Brokers in the list above to get all this free.


