• Bitcoin remains indecisive after correcting loss at $8500.
• The channel break turns BTC bearish on the hourly chart.
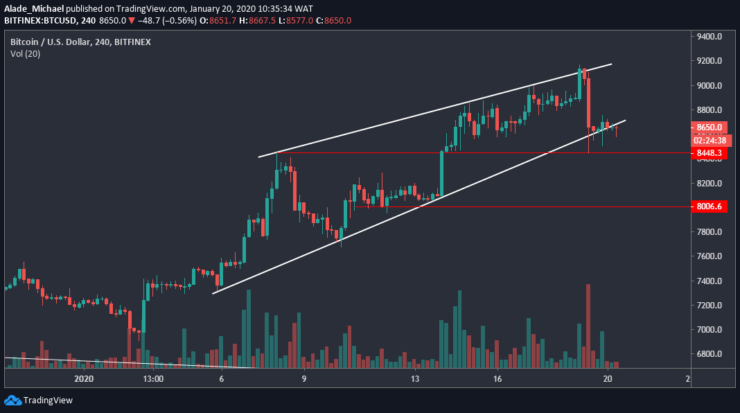
Yesterday, Bitcoin’s price saw a sudden correction from $9150 to $8450 after seeing four weeks of growth. Though, the price has bounced a bit to $8650 – where BTC is currently priced at. If the bulls are unable to regroup well, the price of Bitcoin could roll over to $8000 in the next few days.
Key resistance levels: $8800, $9150
Key support levels: $8450, $8000
Bitcoin (BTC) Price Analysis: 4H Chart – Bullish
Over the past weeks, Bitcoin saw a lot of gains to reach $9150 mark yesterday. After that, the price sharply corrects to $8450 but has now seen a small recovery to $8650. Meanwhile, this bullish pattern is formed inside a wedge. Since the drops, Bitcoin’s price has remained at the wedge’s support. BTC may bounce back to $8800 and $9150 resistance if buyers regroup well.

However, the mid-term bullish wave is still valid but Bitcoin is actually indecisive at the moment. If the BTC market clearly falls from the wedge boundary, the price may retest $8450 support. A break beneath this support could extend selling pressure to $8000. But as of now, there’s no-trade sign in the market.
Bitcoin (BTC) Price Analysis: Hourly Chart – Bearish
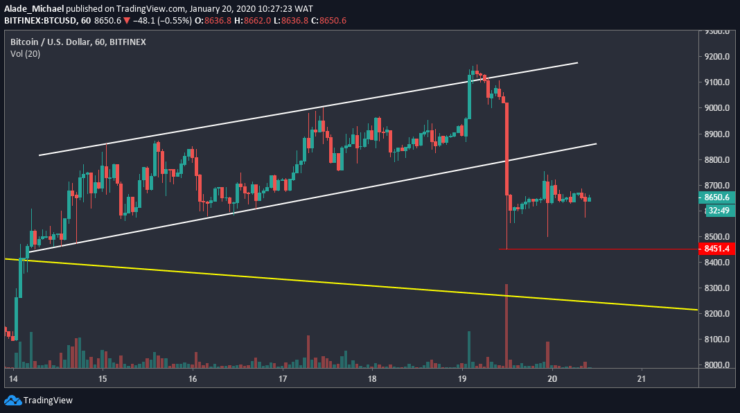
The recent drop in price has caused a sharp pain amongst BTC traders, bringing the price beneath the six days rising channel. As we can see, the market is now subdued with choppy price actions. Currently, Bitcoin is pinned on $8450 support. The channel break has led the sellers back in the market.

If Bitcoin can find support on $8450, the price could retest the channel’s lower boundary at $8800 resistance before selling back. A climb above this resistance could allow more gains to $9000. But if the market falls back to the current support and breaks down, Bitcoin would drop into $8200 support – where the yellow trend line lies. Whichever way, BTC is currently bearish on the hourly chart.
BITCOIN SELL SIGNAL
Sell Entry: $8650
TP: $8500
SL: $8854
- Broker
- Min Deposit
- Score
- Visit Broker
- Award-winning Cryptocurrency trading platform
- $100 minimum deposit,
- FCA & Cysec regulated
- 20% welcome bonus of upto $10,000
- Minimum deposit $100
- Verify your account before the bonus is credited
- Fund Moneta Markets account with a minimum of $250
- Opt in using the form to claim your 50% deposit bonus
Learn to Trade
Never Miss A Trade Again

Signal Notification
Real-time signal notifications whenever a signal is opened, closes or Updated

Get Alerts
Immediate alerts to your email and mobile phone.

Entry Price Levels
Entry price level for every signal Just choose one of our Top Brokers in the list above to get all this free.


