• Bitcoin paused after gaining $1200 in three days, although bullish setup remains valid.
Reaching $9400 yesterday, Bitcoin’s price has seen a lot of gains over the past weeks after rising by a total of 40% since December 2019. The momentum is paused around $9300 with -0.34% losses over the last 24-hours trading. If Bitcoin fails to advance higher, the price may consolidate for a while. However, a downward correction might paint a slight bearish scenario.
Key resistance levels: $9700, $10000
Key support levels: $9000, $8600
Bitcoin (BTC) Price Analysis: 4H Chart – Bullish
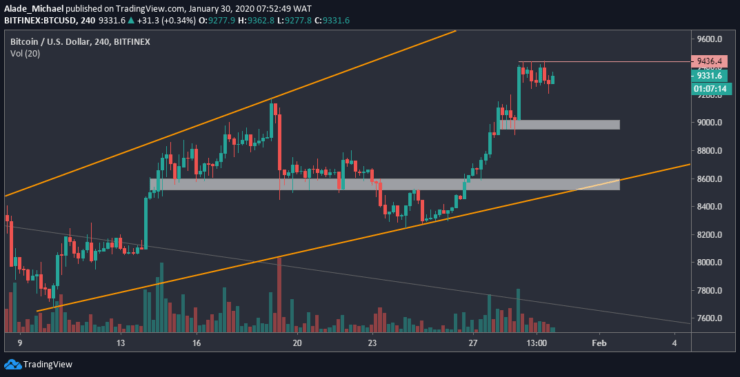
Bitcoin’s price is now stuck in a crucial resistance area of $9400 after regaining momentum from $8300 over last weekend. However, there’s a room for more upward movement if Bitcoin follows this broadening wedge that is formed on the 4-hours chart. The $9700 and $10000 level would be the next buying target once BTC rises beyond the $9436 – marked red on the chart.

In this case, we may need to consider the current consolidation cycle that has held price actions between the ranges of $9200-$9436 zones over the past hours.
In case of a bearish correction, Bitcoin may slump into the white support area of $9000 and $8600. That will come if Bitcoin drops below the $9200. If not, Bitcoin would remain in a consolidation mode before advancing higher. Nonetheless, the most important thing to pay attention to is that volume is against price. BTC volume is down while the price is up. This suggests a bearish divergence is around the corner.
Bitcoin (BTC) Price Analysis: Hourly Chart – Bullish
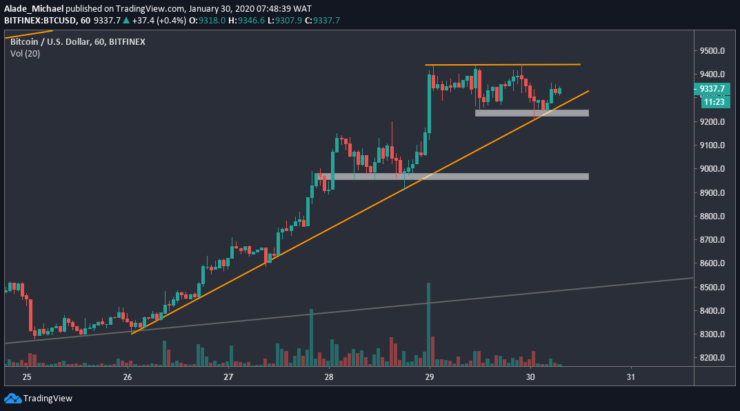
On the hourly chart, the picture is quite big and clear. We can see that the small consolidation cycle is reaching a tight area of the orange trend lines. Bitcoin is expected a breakout in the next few hours. Meanwhile, it’s important to note that the bullish trend is still considered valid at the moment.

Considering a potential breakout, Bitcoin may resume the positive sentiment as soon as the buyers surpass the $9400 resistance. The key level of resistance to watch out for is $9600 and $9800. Negative sentiment is definitely going to cause a huge drop in the BTC market. However, we should consider the white support areas as the next selling level – that is breaking $9200 to $9000 on a short-term.
BITCOIN SELL ORDER
Sell: $9337
TP: $9017
SL: $9477
- Broker
- Min Deposit
- Score
- Visit Broker
- Award-winning Cryptocurrency trading platform
- $100 minimum deposit,
- FCA & Cysec regulated
- 20% welcome bonus of upto $10,000
- Minimum deposit $100
- Verify your account before the bonus is credited
- Fund Moneta Markets account with a minimum of $250
- Opt in using the form to claim your 50% deposit bonus
Learn to Trade
Never Miss A Trade Again

Signal Notification
Real-time signal notifications whenever a signal is opened, closes or Updated

Get Alerts
Immediate alerts to your email and mobile phone.

Entry Price Levels
Entry price level for every signal Just choose one of our Top Brokers in the list above to get all this free.


