• The $8200 level is now a crucial resistance for Bitcoin
Yesterday, Bitcoin saw a small bounce to near $8200 but failed after witnessing a quick sell to $7760. Meanwhile, the current $7700 support has continued to suppress selling pressure. Due to this drops, Bitcoin is now trading back under $8000. In case this current support fails to hold, Bitcoin is likely to extend scenario to the downside.
Key resistance levels: $8200, $8500
Key support levels: $7700, $7500
Bitcoin (BTC) Price Analysis: 4H Chart – Bearish
Following the $8200 rejection yesterday, Bitcoin is now facing the $7700 support that was established on Monday. Currently, it appeared the bears are showing interest again. This time, the $7700 support level could be wiped out with huge selling pressure. If such a scenario occurs, Bitcoin may look for another support around $7500 and below.
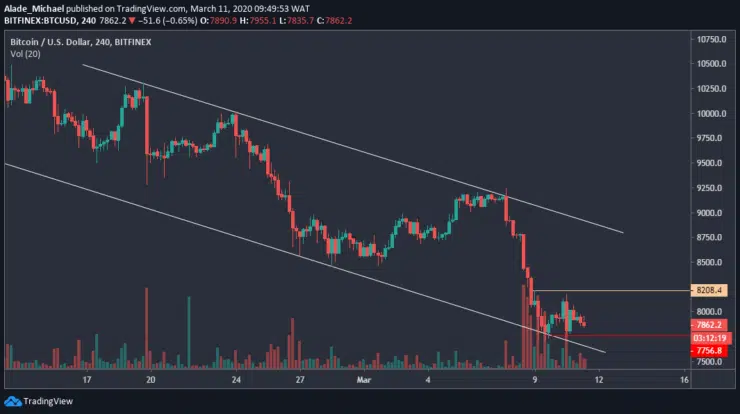
In the opposite direction, the bulls’ hope may be restored if Bitcoin can continue to hold well above the $7700. If this price action plays out, the first level of resistance to watch out for is $8200, from where BTC price got rejected yesterday. A successful climb above this resistance would allow further buy to $8500, around the channel’s resistance. Nonetheless, Bitcoin is still looking bearish on the 4-hours chart.
Bitcoin (BTC) Price Analysis: Hourly Chart – Bearish
Bitcoin is revealed in a downward range on the hourly chart, but the price has been moving sideways over the past 48-hours now. The ongoing consolidation suggests a potential change in trend. As we can see, Bitcoin is preparing for another dip. If the price falls significantly below the red support line of $7750, Bitcoin may found new support around $7600 and $7500.
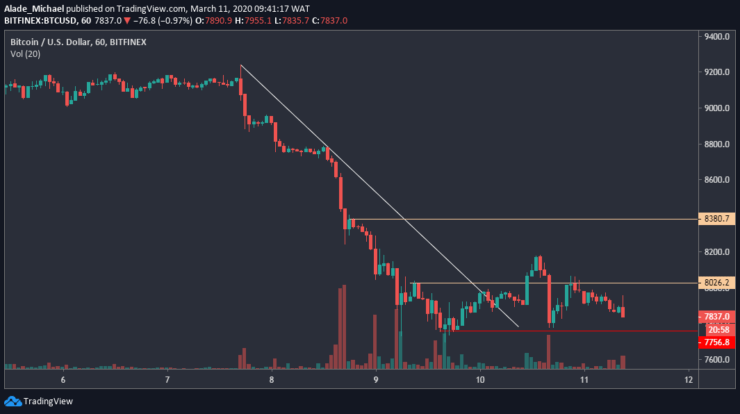
Following yesterday’s false break above $8000, Bitcoin now created resistance at $8180. If Bitcoin regains momentum above this new resistance, the next buying target would be $8380, marked orange on the hourly chart. Above this resistance, more gains are expected to come into play.
BITCOIN SELL ORDER
Sell: $7850
TP: $7760
SL: $8055
- Broker
- Min Deposit
- Score
- Visit Broker

- Award-winning Cryptocurrency trading platform
- $100 minimum deposit,
- FCA & Cysec regulated

- 20% welcome bonus of upto $10,000
- Minimum deposit $100
- Verify your account before the bonus is credited
- Fund Moneta Markets account with a minimum of $250
- Opt in using the form to claim your 50% deposit bonus
Learn to Trade
Never Miss A Trade Again

Signal Notification
Real-time signal notifications whenever a signal is opened, closes or Updated

Get Alerts
Immediate alerts to your email and mobile phone.

Entry Price Levels
Entry price level for every signal Just choose one of our Top Brokers in the list above to get all this free.