• Buyers eye $10500 but Bitcoin is looking for near support for a rebound
Yesterday, Bitcoin successfully close above the $10000 price level after seeing a moderate gain from $9450 low. Currently, Bitcoin is trading around $10100 with a $183.5 billion market cap. We can expect the upswing to continue soonest. Reclaiming $10482 resistance is important. Otherwise, the short-term bull sentiment is likely to end.
Key resistance levels: $10250, $10500
Key support levels: $9850, $9700
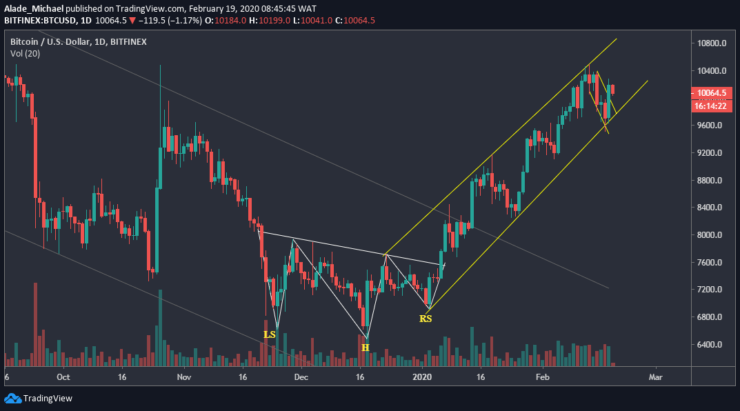
Bitcoin (BTC) Price Analysis: Daily Chart – Bullish
Bitcoin started a new bullish rally after witnessing a minor correction over the past few days. Despite this correction, the price continued to respect the rising channel that was formed since early January. From $9450 low, Bitcoin has added up by $700 to reach $10250 yesterday.

The price has dropped a bit to $10100, looking for support around $10000. If Bitcoin regains momentum above this support, we can expect buying to $10250 and $10500 resistance in the coming day. It might even reach $10800 if the bulls can surpass the monthly high.
A drop below $10000 level could cause a panic sell at $9850 and $97000. That will occur if Bitcoin continues to show weakness. As it stands now, buyers are showing interest as more growth is expected in the future.
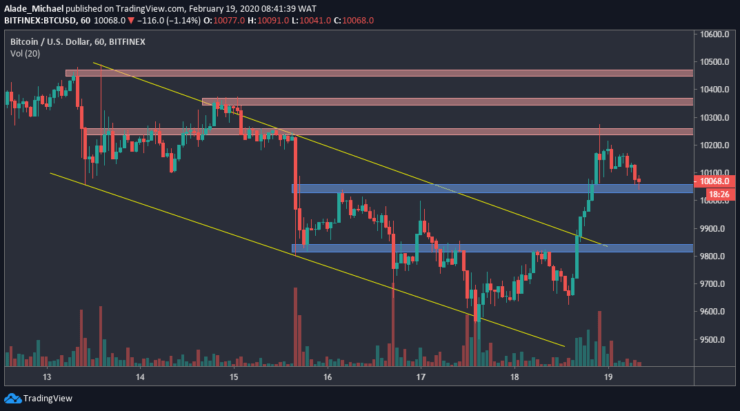
Bitcoin (BTC) Price Analysis: Hourly Chart – Bullish
Few minutes after our previous crypto trading signals, Bitcoin surged to $10250 following a rally from $9600, though the initial setup was plotted from $9450. The bullish move was confirmed with a channel breakout. Following the ongoing retracement to the blue zone of $10050, Bitcoin is expected to bounce back shortly.

However, Bitcoin is likely to face a multiple resistance in the coming bullish swing. The key resistance level to watch out for is red areas of $10350 and $10450, though the previous resistance ($10250) is important.
In case Bitcoin falls below the current blue support zone, the key support to keep in mind is the next blue area of $9830. Below this support lies $9600 from where Bitcoin regained momentum back yesterday. Looking at this setup, there’s high probability for bullish than bearish.
BITCOIN BUY ORDER
Buy: $10063
TP: $10350
SL: $9900
- Broker
- Min Deposit
- Score
- Visit Broker
- Award-winning Cryptocurrency trading platform
- $100 minimum deposit,
- FCA & Cysec regulated
- 20% welcome bonus of upto $10,000
- Minimum deposit $100
- Verify your account before the bonus is credited
- Fund Moneta Markets account with a minimum of $250
- Opt in using the form to claim your 50% deposit bonus
Learn to Trade
Never Miss A Trade Again

Signal Notification
Real-time signal notifications whenever a signal is opened, closes or Updated

Get Alerts
Immediate alerts to your email and mobile phone.

Entry Price Levels
Entry price level for every signal Just choose one of our Top Brokers in the list above to get all this free.


