• Bitcoin’s price cuts $2400 in a day to reach a 3-month low
• If Bitcoin finds support on the weekly triangle, we can anticipate a quick recovery in no time.
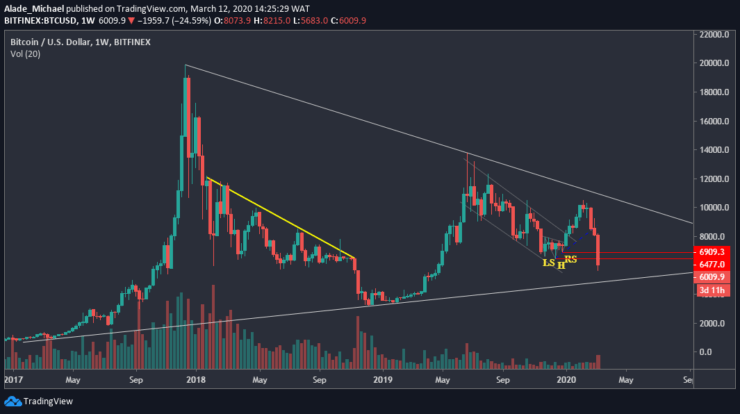
Today, Bitcoin saw another big shock-wave in the market, crashing 33% from $8000 to $5600 a few hours ago. So far, today’s drops recorded the biggest daily volumes in past months. At the time of writing, Bitcoin is trading at $5800 – the November 2018 support. More so, the latest break below the 2019 low of $6500 indicates a strong bearish reversal which is likely to reach $5000 in the next rally.
Key resistance levels: $6400, $6900
Key support levels: $5600, $5000
Bitcoin (BTC) Price Analysis: Weekly Chart – Bearish
Bitcoin’s bearishness is likely to end soon if the price actions respect the symmetrical triangle that started to form in late 2017. But the bearish scenario could still extend to the $5000 on the triangle’s lower boundary. Bitcoin would need to drop below today’s $5600 low before we can consider further selling.

From above, Bitcoin is holding major resistance at $10000. In case of a retracement, we may see a small pullback to $6400-$6900 resistance areas. Resistance above this level is $8000, from where Bitcoin initiated sell today. Currently, the volume on the weekly chart is still pretty fading at the moment. If Bitcoin breaks down this triangle, a huge selloff should be expected.
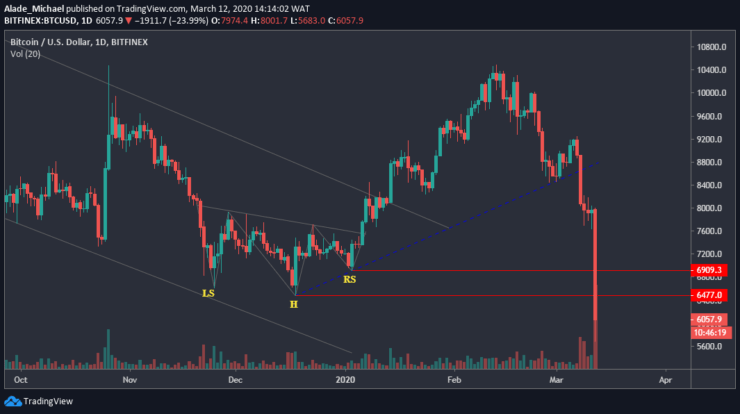
Bitcoin (BTC) Price Analysis: Daily Chart – Bearish
Bitcoin took out a lot of buying position following a false pin bar that wicked at $7600 yesterday. However, this bearish reaction led to a huge price dump to $5600 today. While the bears keep showing strong commitment, Bitcoin is attempting to drop lower.

Though, Bitcoin is currently priced at $5800. In case the price drops lower and breaks beneath the $5600, the next key level to watch out for is $5000. On the upside, there’s a close resistance at $6500 – the first red line. If Bitcoin pulls beyond the second red line of $6900, we can expect a further gain. But at the moment, Bitcoin is still strongly bearish on the daily chart
BITCOIN SELL ORDER
Sell: $6000
TP: $5600
SL: $6100
- Broker
- Min Deposit
- Score
- Visit Broker
- Award-winning Cryptocurrency trading platform
- $100 minimum deposit,
- FCA & Cysec regulated
- 20% welcome bonus of upto $10,000
- Minimum deposit $100
- Verify your account before the bonus is credited
- Fund Moneta Markets account with a minimum of $250
- Opt in using the form to claim your 50% deposit bonus
Learn to Trade
Never Miss A Trade Again

Signal Notification
Real-time signal notifications whenever a signal is opened, closes or Updated

Get Alerts
Immediate alerts to your email and mobile phone.

Entry Price Levels
Entry price level for every signal Just choose one of our Top Brokers in the list above to get all this free.


