• A significant bullish rally is expected if Bitcoin can reclaim monthly high
Following a three days correction, Bitcoin saw a 7% drop to $9450 low yesterday after marking $10500 last week. Though Bitcoin has managed to recover back to where it’s now trading near $10000.The buyers appeared to have shown commitment again. So, we can expect a significant rally if the price further climbs. However, we may need to worry about bearishness if the price remains under $10000.
Key resistance levels: $10000, $10250, $10500
Key support levels: $9850, $9700, $9450
Bitcoin (BTC) Price Analysis: 4H Chart – Bullish
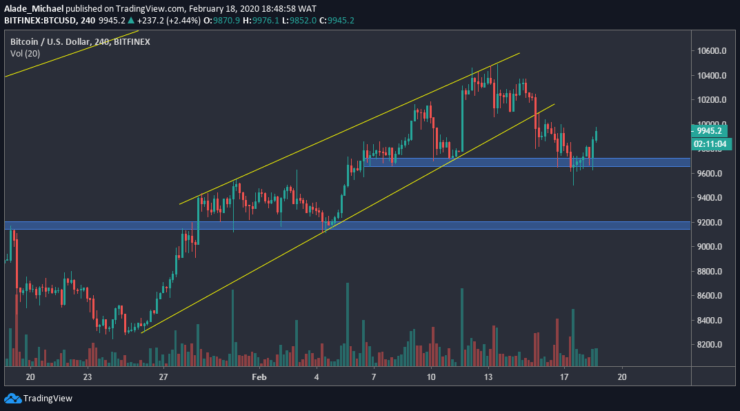
Bitcoin broke down from a rising wedge after witnessing a huge price movement over the past few days. This bearishness made BTC price to cut $1000, but the market bounced back following a long-wick rejection at $9450. The bounced was followed by quick gains to $9945 at the moment.

If Bitcoin continues to show strength, the next resistance to watch is $10250 and $10500. Meanwhile, the $10000 resistance is an important break level. If the price fails to break this resistance level, Bitcoin may retest $9850 support.
It may even roll back to the blue support area of $9700. Below this support lies $9450, which was yesterday’s low. Considering the latest buying pressure, Bitcoin is expected to grow more in the coming days.
Bitcoin (BTC) Price Analysis: Hourly Chart – Bullish
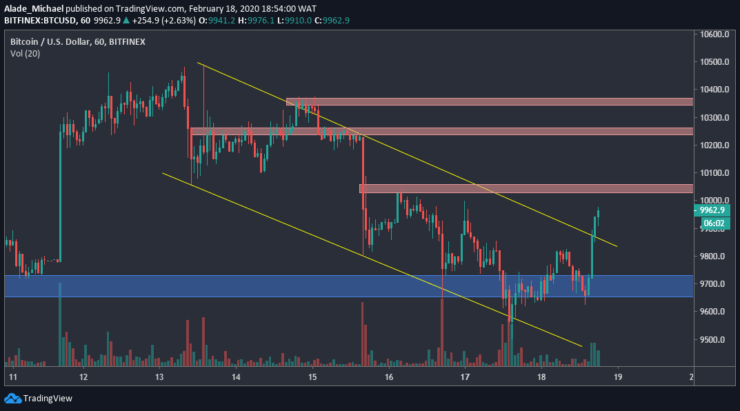
After losing momentum to $9450, Bitcoin found support and started a fresh increase at $9700 support – the blue zone on the hourly chart. The upward movement was followed by a breakout from a descending channel that held Bitcoin’s price for four days.

This price break is almost reaching a significant resistance at $10000 – the red area. In case the buyers overcome this crucial resistance, the next level of resistance here is $10250 and $10350 at the subsequent red area. Surpassing these red zones would allow Bitcoin to reclaim the monthly high of $10482.
On the other hand, Bitcoin’s support is located at $9900, $9800 and $9700 in the blue zone. A drop below this blue zone would trigger a bearish continuation. But for now, bulls have taken over. We should expect a massive increase in the next few days.
BITCOIN BUY ORDER
Buy: $9913
TP: $9400
SL: $9750
- Broker
- Min Deposit
- Score
- Visit Broker
- Award-winning Cryptocurrency trading platform
- $100 minimum deposit,
- FCA & Cysec regulated
- 20% welcome bonus of upto $10,000
- Minimum deposit $100
- Verify your account before the bonus is credited
- Fund Moneta Markets account with a minimum of $250
- Opt in using the form to claim your 50% deposit bonus
Learn to Trade
Never Miss A Trade Again

Signal Notification
Real-time signal notifications whenever a signal is opened, closes or Updated

Get Alerts
Immediate alerts to your email and mobile phone.

Entry Price Levels
Entry price level for every signal Just choose one of our Top Brokers in the list above to get all this free.


