• Bitcoin drops to $9300 after seeing a -3% discount overnight.
• The bullish sentiment may suspend for a while if Bitcoin breaks $9200 support.
Following a -3% losses overnight, Bitcoin has now dropped to around $9300 after testing $9555 as weekly high. This price cut pulled Bitcoin beneath the trend line on the hourly chart. It may lead to another correction if the price further drops. However, buyers are still present. So, there’s hope for more upswing if they can reinforce stronger.
Key resistance levels: $9700, $10000
Key support levels: $9000, $8600
Bitcoin (BTC) Price Analysis: 4H Chart – Bullish
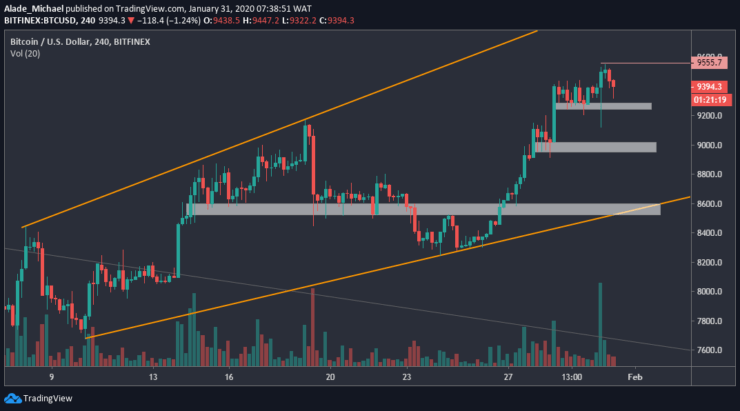
After dropping sharply to $9100 yesterday, Bitcoin got bought back to $9500 before marking a daily high at $9555. The bears have reacted again with a discount to $9300. Bitcoin’s price is technically overbought on the mid-term. We may experience a short move sooner than later.

In anticipation of a bearish move, we may need to keep an eye on the immediate white support are ($9200) that BTC is targeting at the moment. A colossal drop could send price to $9000 and $8600, right on the wedge’s support before bouncing back. Inversely, Bitcoin may keep growing towards the wedge’s resistance $9700 and $10000 if the $9555 resistance breaks.
Bitcoin (BTC) Price Analysis: Hourly Chart – Bullish
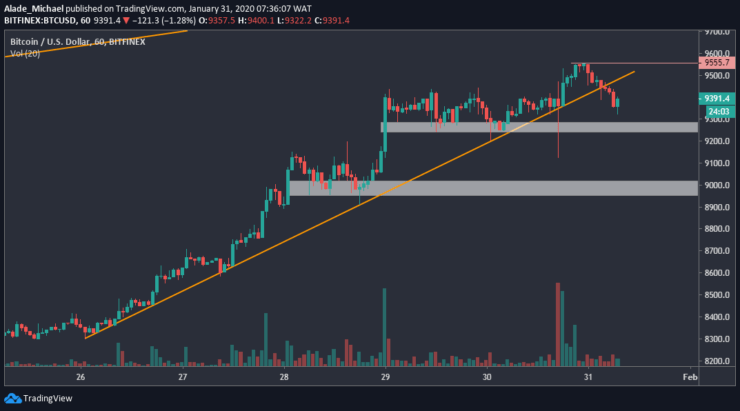
Bitcoin has dropped beneath the orange rising trend line that was providing support for the market since January 26. This break could become devastating if BTC pulls beyond the $9250, though the key breakout level lies at $9100 – where Bitcoin’s price was rejected yesterday. Next to this level lies psychological support of $9000 – right in the second white zone.

In case Bitcoin dips and finds support at these mentioned price levels, we should expect a quick bounce to $9555. But if the current pullback turns false, Bitcoin would continue to advance higher after reclaiming the previous resistance. The next buying target would be $9700 and $9800. From a technical standpoint, Bitcoin is overbought and ready to correct downward.
BITCOIN SELL ORDER
Sell: $9394
TP: $9104 / $9034
SL: $9614
- Broker
- Min Deposit
- Score
- Visit Broker
- Award-winning Cryptocurrency trading platform
- $100 minimum deposit,
- FCA & Cysec regulated
- 20% welcome bonus of upto $10,000
- Minimum deposit $100
- Verify your account before the bonus is credited
- Fund Moneta Markets account with a minimum of $250
- Opt in using the form to claim your 50% deposit bonus
Learn to Trade
Never Miss A Trade Again

Signal Notification
Real-time signal notifications whenever a signal is opened, closes or Updated

Get Alerts
Immediate alerts to your email and mobile phone.

Entry Price Levels
Entry price level for every signal Just choose one of our Top Brokers in the list above to get all this free.


