• Bearish actions might get worse if Bitcoin drops below $9500
The situation for Bitcoin now shows bearish signs than before considering the sudden rejection from $10000 to $9562 on Bitfinex a few hours ago. As a result of this, Bitcoin is now priced at $9700 after dropping 1.55%.
We may see a huge dump to $9000 if Bitcoin fails to stay above $9500. Currently, the bears are preparing for another rally as bulls struggle along. However, BTC may bounce back if buyers show strong interest.
Key resistance levels: $10000, $10250, $10400
Key support levels: $9562, $9300, $9200
Bitcoin (BTC) Price Analysis: 4H – Bearish
Bitcoin continued to form a bearish pattern after failing to break above $10000 resistance. Though, the market saw a four days recovery after dropping from a rising channel to $9300 on February 19. Earlier today, Bitcoin showed weakness and dropped into the green demand area of $9562, which was supported by the small rising trend line.
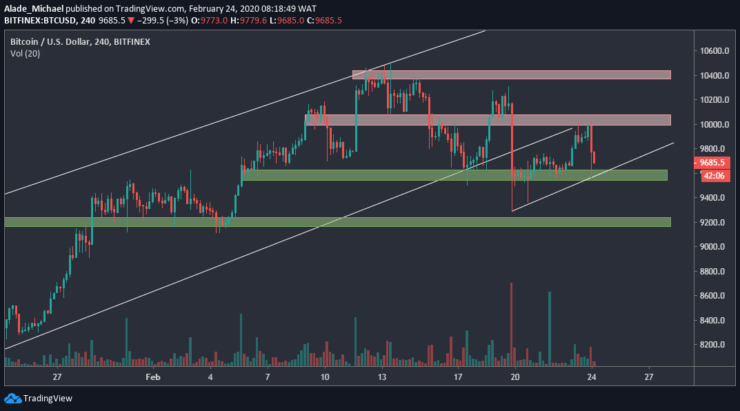
Despite bouncing off this mentioned support area, the bears keep regrouping. If they manage to conquer this trend line and pull below the immediate demand area, the next level to watch is the lower green demand area of $9200.
Meanwhile, sellers might encounter close support at $9300. In case Bitcoin finds support on the rising trend line, buyers could reclaim $10000 again before climbing further at $10250 and $10400 – the red resistance area.
Bitcoin (BTC) Price Analysis: Hourly Chart – Bearish
Bitcoin is stylishly correcting inside a descending channel on the hourly chart. The latest bearish actions came after touching the channel’s resistance of $10000. Meanwhile, Bitcoin has found support on a grey rising trend line that was drawn from February 19 low of $9300.
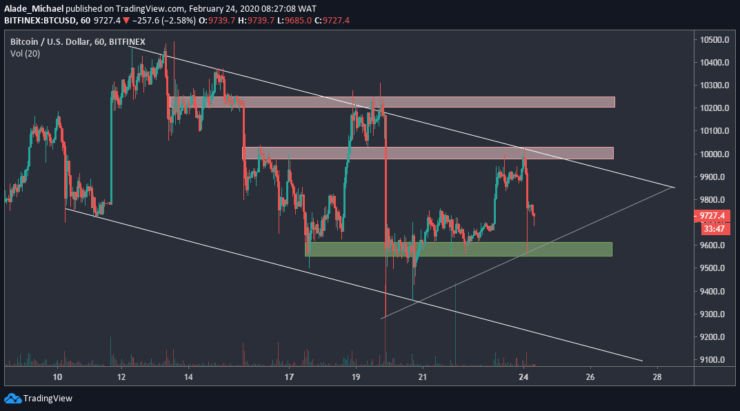
The quick rejection from the green support area of $9560 has rekindled the bulls’ hope a bit. Similarly, Bitcoin’s price is nearing a tight area. A drop below the green area could cause a huge selloff to $9300 or even $9200.
But if BTC show strength again, buying pressure may propel into the red resistance area of $10000, slightly above the channel. Above this resistance lies $10250 and $10400. Regardless of the above, Bitcoin remains bearish on the hourly chart.
BITCOIN SELL ORDER
Sell: $9700
TP: $9300
SL: $9830
- Broker
- Min Deposit
- Score
- Visit Broker

- Award-winning Cryptocurrency trading platform
- $100 minimum deposit,
- FCA & Cysec regulated

- 20% welcome bonus of upto $10,000
- Minimum deposit $100
- Verify your account before the bonus is credited
- Fund Moneta Markets account with a minimum of $250
- Opt in using the form to claim your 50% deposit bonus
Learn to Trade
Never Miss A Trade Again

Signal Notification
Real-time signal notifications whenever a signal is opened, closes or Updated

Get Alerts
Immediate alerts to your email and mobile phone.

Entry Price Levels
Entry price level for every signal Just choose one of our Top Brokers in the list above to get all this free.