Bitcoin (BTC) Price Analysis – October 14
Following last week unexpected rebound, Bitcoin touched $8800 after plummeting to $7733 support on September 24. But today, BTC dominance has dropped to 66.4% along with a current price reduction of -0.88%, making the market to trade below $8300 zone. This is due to the recent bearish interest in the market. We can expect a bullish impulsive move if Bitcoin can rise back above $8800
Bitcoin (BTC) Price Analysis: Daily Chart – Bearish
Key resistance levels: $8533, $8815. $9000, $9200
Key support levels: $8000, $7733, $7000, $6500
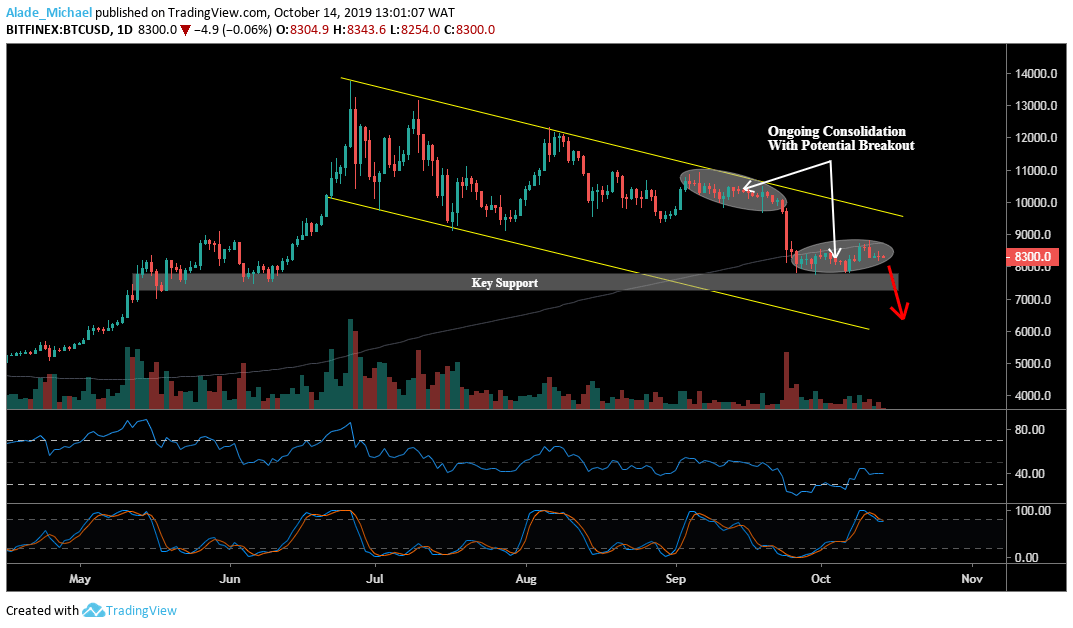
Bitcoin’s continues to remain bearish on the daily chart but the last 20 days squeeze has made the market to stay in a consolidation mode. From the $7733 low, Bitcoin has managed to rise in a short-term to $8815, where the important 200-day moving average lies. Following September’s bearish formation, the crypto trading signals a potential breakout to $6500 but the bears need to clear the key support at $8000, $7733 and $7000.

Meanwhile, the RSI is currently indecisive at the moment. A cross above the 50 level should signal a buy to $8533, $8815 and $9000 resistance. $9200 may as well play out for a further rise. Bitcoin is now sitting on the upper limit of the Stochastic RSI. Falling below the 80 could produce a bearish cross.
Bitcoin (BTC) Price Analysis: 4H Chart – Neutral
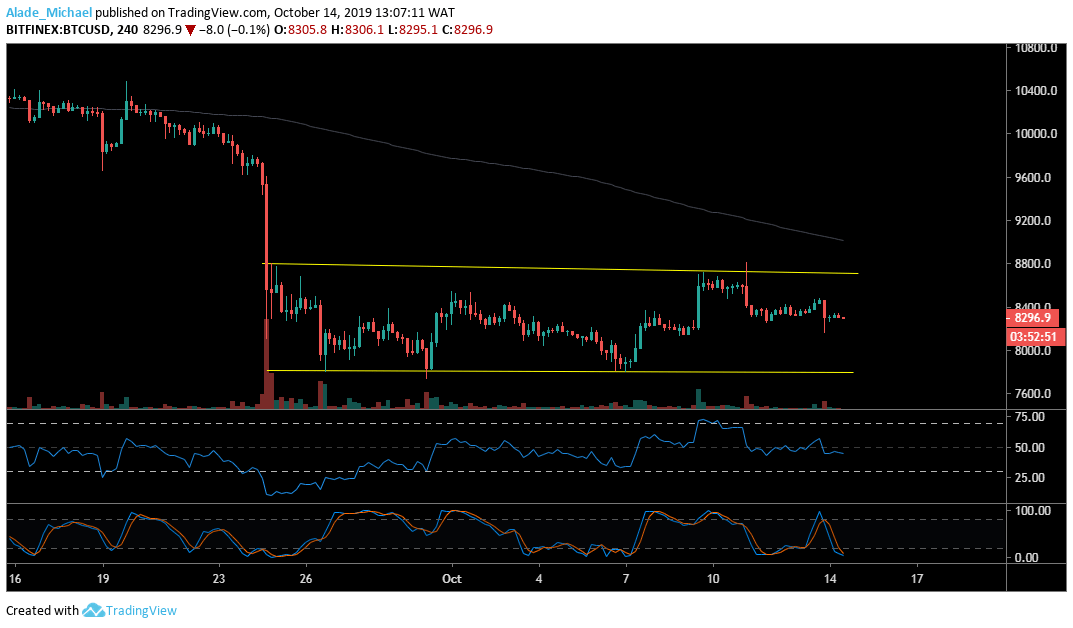
Bitcoin is moving in a range-bound on the 4-hour time frame, although carving a channel pattern alongside. Touching $8800 during last week’s trading made Bitcoin’s to the meet rejection at the upper boundary of channel. Now, it appears that the price is correcting back to the lower boundary of the channel, which has brought us to $8300 at the moment. A further drop could trigger a steep decline to around $8000 and $7700 support zones.

As we can see, the RSI is slowly turning bearish due to the last three days of bearish action. Now, the crypto trading signals an oversold market on the Stochastic RSI. If the indicator could produce a bullish crossover, Bitcoin may rise back to $8500 and $8800 resistance. Breaking up the channel could make the market to print new monthly high at around the $9000 – where the 200-day moving average lies.
BITCOIN SELL SIGNAL
Sell Entry: $8287
TP: $8021
SL: $8500
- Broker
- Min Deposit
- Score
- Visit Broker
- Award-winning Cryptocurrency trading platform
- $100 minimum deposit,
- FCA & Cysec regulated
- 20% welcome bonus of upto $10,000
- Minimum deposit $100
- Verify your account before the bonus is credited
- Fund Moneta Markets account with a minimum of $250
- Opt in using the form to claim your 50% deposit bonus
Learn to Trade
Never Miss A Trade Again

Signal Notification
Real-time signal notifications whenever a signal is opened, closes or Updated

Get Alerts
Immediate alerts to your email and mobile phone.

Entry Price Levels
Entry price level for every signal Just choose one of our Top Brokers in the list above to get all this free.


