Don’t invest unless you’re prepared to lose all the money you invest. This is a high-risk investment and you are unlikely to be protected if something goes wrong. Take 2 minutes to learn more
Bitcoin (BTCUSD) Bullish Momentum Slows
Bitcoin crypto struggles as buyer pressure meets resistance. BTCUSD recently reached a high near $75,470 but has since lost momentum, as buyers encounter significant resistance. After a robust upward surge that broke several key levels, Bitcoin faced strong selling pressure at $72,880, prompting a corrective pullback toward the $67,500 zone. Despite this setback, buyers remain confident, keeping the bullish outlook alive as they work to regain momentum.
BTCUSD Price Levels
Resistance: $72,880, $75,470
Support: $67,500, $63,800 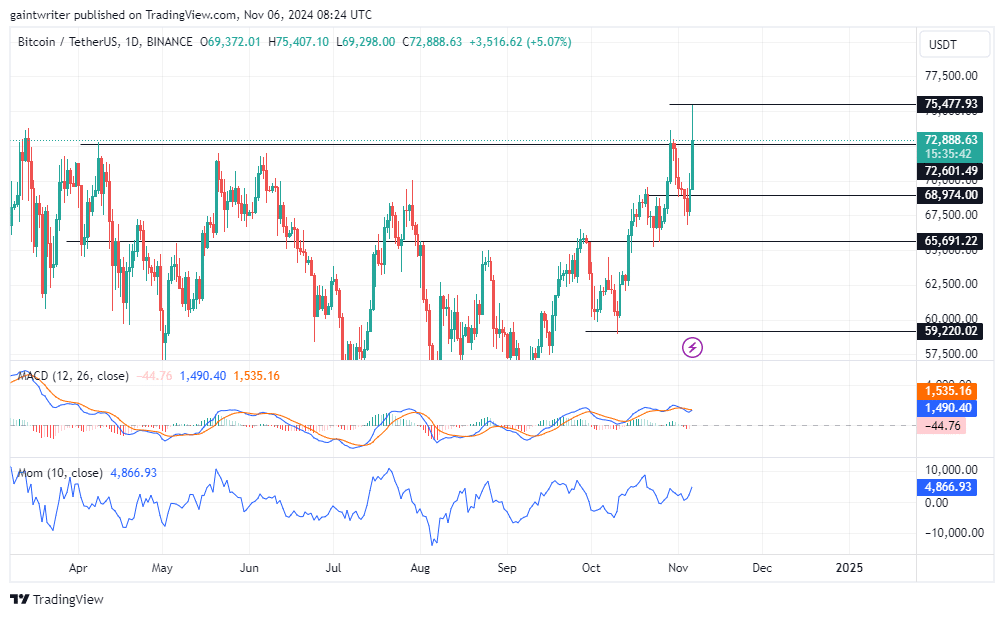 .00001740, .00001940
Resistance Levels: .00002410
After stabilizing at the .00001740 level, buyers have reclaimed momentum. They are now pushing prices above the critical .00001940 resistance and raising prospects for further gains.
Lucky Block – Guide, Tips & Insights | Learn 2 Trade Price Forecast – Expert Analysis & Trading Tips | Learn 2 Trade – Expert Analysis & Trading Tips | Learn 2 Trade - LBLOCKUSD Outlook
Last week, sellers aimed to extend the decline, testing the .00001940 support level during a phase of consolidation. However, buyers have shown resilience, signaling a possible reversal of the bearish momentum. This shift suggests that a breakout toward the .00002410 level is feasible if buyers sustain the pressure.
The Moving Average Convergence Divergence (MACD) indicator favors buyers, showing increased buying pressure against recent bearish sentiment. Other momentum indicators also indicate a bullish trend, underscoring the potential for buyers to take advantage of current market conditions.
With the market leaning toward a bullish trend, Lucky Block – Guide, Tips & Insights | Learn 2 Trade buyers have a clear path to test the .00002410 resistance level in the near term. Sustained buying activity could drive prices to new highs, setting an optimistic outlook for Lucky Block – Guide, Tips & Insights | Learn 2 Trade's upcoming sessions.
Lucky Block – Guide, Tips & Insights | Learn 2 Trade Medium Term Trend: Bullish (4-hour chart)
On shorter time frames, buyers continue to strengthen, gradually mitigating remaining bearish pressure. The sell traders are likely to be limited in their pursuit for a while this week.
The positive momentum shift, highlighted by both the MACD and other momentum indicators, signals a likely continuation of gains. The bearish strength is therefore likely to decline.
https://www.tradingview.com/x/AnTvl0xp/
https://www.tradingview.com/x/to3M0hrb/
Bitcoin Falters Amid Buyer Pressure as Bulls Face Resistance" width="1004" height="617" data-lazy-src="https://learn2.trade/wp-content/uploads/2024/11/BTCUSD-1DAY-1.png"/>
.00001740, .00001940
Resistance Levels: .00002410
After stabilizing at the .00001740 level, buyers have reclaimed momentum. They are now pushing prices above the critical .00001940 resistance and raising prospects for further gains.
Lucky Block – Guide, Tips & Insights | Learn 2 Trade Price Forecast – Expert Analysis & Trading Tips | Learn 2 Trade – Expert Analysis & Trading Tips | Learn 2 Trade - LBLOCKUSD Outlook
Last week, sellers aimed to extend the decline, testing the .00001940 support level during a phase of consolidation. However, buyers have shown resilience, signaling a possible reversal of the bearish momentum. This shift suggests that a breakout toward the .00002410 level is feasible if buyers sustain the pressure.
The Moving Average Convergence Divergence (MACD) indicator favors buyers, showing increased buying pressure against recent bearish sentiment. Other momentum indicators also indicate a bullish trend, underscoring the potential for buyers to take advantage of current market conditions.
With the market leaning toward a bullish trend, Lucky Block – Guide, Tips & Insights | Learn 2 Trade buyers have a clear path to test the .00002410 resistance level in the near term. Sustained buying activity could drive prices to new highs, setting an optimistic outlook for Lucky Block – Guide, Tips & Insights | Learn 2 Trade's upcoming sessions.
Lucky Block – Guide, Tips & Insights | Learn 2 Trade Medium Term Trend: Bullish (4-hour chart)
On shorter time frames, buyers continue to strengthen, gradually mitigating remaining bearish pressure. The sell traders are likely to be limited in their pursuit for a while this week.
The positive momentum shift, highlighted by both the MACD and other momentum indicators, signals a likely continuation of gains. The bearish strength is therefore likely to decline.
https://www.tradingview.com/x/AnTvl0xp/
https://www.tradingview.com/x/to3M0hrb/
Bitcoin Falters Amid Buyer Pressure as Bulls Face Resistance" width="1004" height="617" data-lazy-src="https://learn2.trade/wp-content/uploads/2024/11/BTCUSD-1DAY-1.png"/>
Currently, BTC/USD has managed to break through the $72,880 mark, indicating buyers’ intentions to push higher. However, buying pressure is beginning to taper, and bullish momentum is waning. This suggests that while the overall trend remains upward, bulls may need to consolidate before attempting another push.
The Momentum Indicator shows strong initial buying, though it has recently weakened, signaling that sellers might take advantage of this slowdown for a temporary pullback. Meanwhile, the MACD (Moving Average Convergence Divergence) indicator remains bullish, with positive divergence indicating that buyers still hold some control.
Market Expectation
On shorter time frames, BTC’s bullish momentum has softened, giving sellers a brief opening. This could lead to a period of consolidation or a slight correction, with buyers likely to regroup for another rally once momentum rebuilds.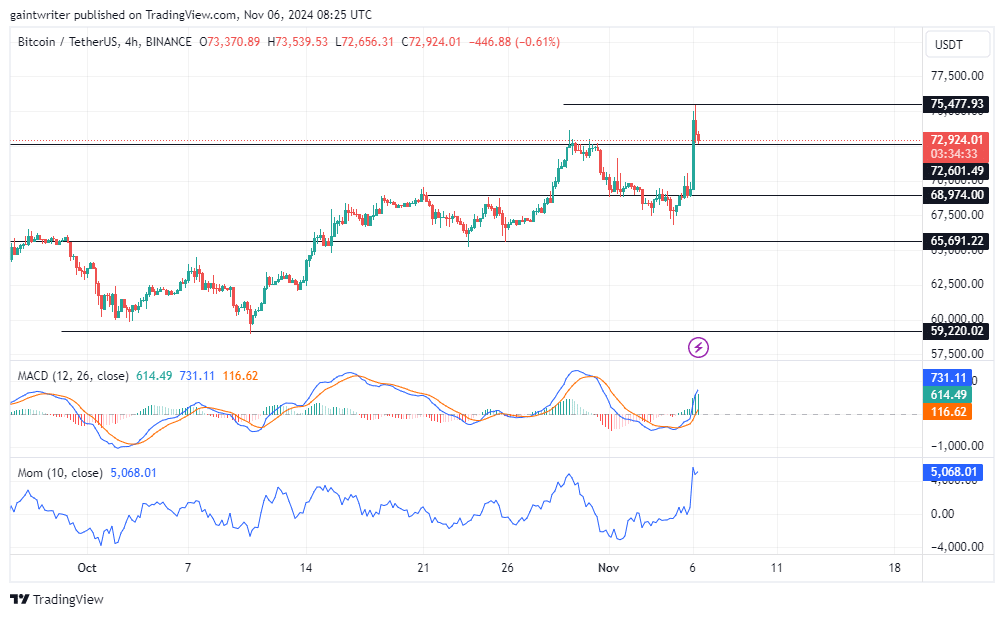 .00001740, .00001940
Resistance Levels: .00002410
After stabilizing at the .00001740 level, buyers have reclaimed momentum. They are now pushing prices above the critical .00001940 resistance and raising prospects for further gains.
Lucky Block – Guide, Tips & Insights | Learn 2 Trade Price Forecast – Expert Analysis & Trading Tips | Learn 2 Trade – Expert Analysis & Trading Tips | Learn 2 Trade - LBLOCKUSD Outlook
Last week, sellers aimed to extend the decline, testing the .00001940 support level during a phase of consolidation. However, buyers have shown resilience, signaling a possible reversal of the bearish momentum. This shift suggests that a breakout toward the .00002410 level is feasible if buyers sustain the pressure.
The Moving Average Convergence Divergence (MACD) indicator favors buyers, showing increased buying pressure against recent bearish sentiment. Other momentum indicators also indicate a bullish trend, underscoring the potential for buyers to take advantage of current market conditions.
With the market leaning toward a bullish trend, Lucky Block – Guide, Tips & Insights | Learn 2 Trade buyers have a clear path to test the .00002410 resistance level in the near term. Sustained buying activity could drive prices to new highs, setting an optimistic outlook for Lucky Block – Guide, Tips & Insights | Learn 2 Trade's upcoming sessions.
Lucky Block – Guide, Tips & Insights | Learn 2 Trade Medium Term Trend: Bullish (4-hour chart)
On shorter time frames, buyers continue to strengthen, gradually mitigating remaining bearish pressure. The sell traders are likely to be limited in their pursuit for a while this week.
The positive momentum shift, highlighted by both the MACD and other momentum indicators, signals a likely continuation of gains. The bearish strength is therefore likely to decline.
https://www.tradingview.com/x/AnTvl0xp/
https://www.tradingview.com/x/to3M0hrb/
Bitcoin Falters Amid Buyer Pressure as Bulls Face Resistance" width="1004" height="617" data-lazy-src="https://learn2.trade/wp-content/uploads/2024/11/BTCUSD-4HRS-1.png"/>
.00001740, .00001940
Resistance Levels: .00002410
After stabilizing at the .00001740 level, buyers have reclaimed momentum. They are now pushing prices above the critical .00001940 resistance and raising prospects for further gains.
Lucky Block – Guide, Tips & Insights | Learn 2 Trade Price Forecast – Expert Analysis & Trading Tips | Learn 2 Trade – Expert Analysis & Trading Tips | Learn 2 Trade - LBLOCKUSD Outlook
Last week, sellers aimed to extend the decline, testing the .00001940 support level during a phase of consolidation. However, buyers have shown resilience, signaling a possible reversal of the bearish momentum. This shift suggests that a breakout toward the .00002410 level is feasible if buyers sustain the pressure.
The Moving Average Convergence Divergence (MACD) indicator favors buyers, showing increased buying pressure against recent bearish sentiment. Other momentum indicators also indicate a bullish trend, underscoring the potential for buyers to take advantage of current market conditions.
With the market leaning toward a bullish trend, Lucky Block – Guide, Tips & Insights | Learn 2 Trade buyers have a clear path to test the .00002410 resistance level in the near term. Sustained buying activity could drive prices to new highs, setting an optimistic outlook for Lucky Block – Guide, Tips & Insights | Learn 2 Trade's upcoming sessions.
Lucky Block – Guide, Tips & Insights | Learn 2 Trade Medium Term Trend: Bullish (4-hour chart)
On shorter time frames, buyers continue to strengthen, gradually mitigating remaining bearish pressure. The sell traders are likely to be limited in their pursuit for a while this week.
The positive momentum shift, highlighted by both the MACD and other momentum indicators, signals a likely continuation of gains. The bearish strength is therefore likely to decline.
https://www.tradingview.com/x/AnTvl0xp/
https://www.tradingview.com/x/to3M0hrb/
Bitcoin Falters Amid Buyer Pressure as Bulls Face Resistance" width="1004" height="617" data-lazy-src="https://learn2.trade/wp-content/uploads/2024/11/BTCUSD-4HRS-1.png"/>
Make money without lifting your fingers: Start using a world-class auto trading solution
How To Buy Lucky Block – Guide, Tips & Insights | Learn 2 Trade
Note: Learn2.trade is not a financial advisor. Do your research before investing your funds in any financial asset, product, or event. We are not responsible for your investment results.
- Broker
- Min Deposit
- Score
- Visit Broker

- Award-winning Cryptocurrency trading platform
- $100 minimum deposit,
- FCA & Cysec regulated

- 20% welcome bonus of upto $10,000
- Minimum deposit $100
- Verify your account before the bonus is credited
- Fund Moneta Markets account with a minimum of $250
- Opt in using the form to claim your 50% deposit bonus
Learn to Trade
Never Miss A Trade Again

Signal Notification
Real-time signal notifications whenever a signal is opened, closes or Updated

Get Alerts
Immediate alerts to your email and mobile phone.

Entry Price Levels
Entry price level for every signal Just choose one of our Top Brokers in the list above to get all this free.