Key Highlights
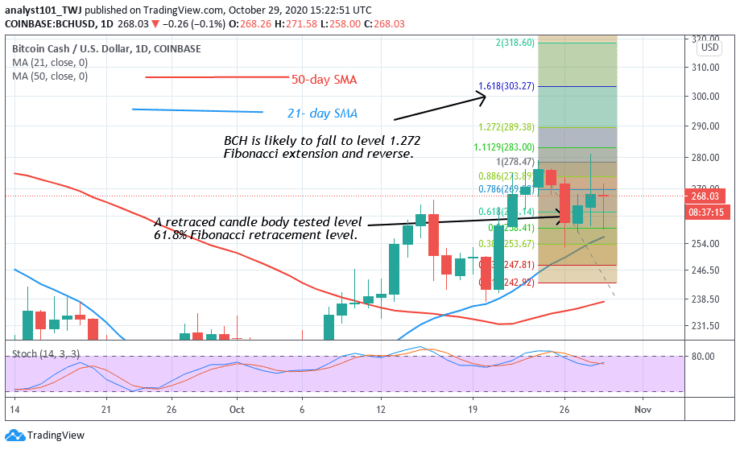
BCH targets another high of $303.27
BCH faces rejection at $280 high
Bitcoin Cash (BCH) Current Statistics
The current price: $267.64
Market Capitalization: $4,966,857,562
Trading Volume: $2,743,825,118
Major supply zones: $325, , $350,$375
Major demand zones: $200, $175, $150
Bitcoin Cash (BCH) Price Analysis October 29, 2020
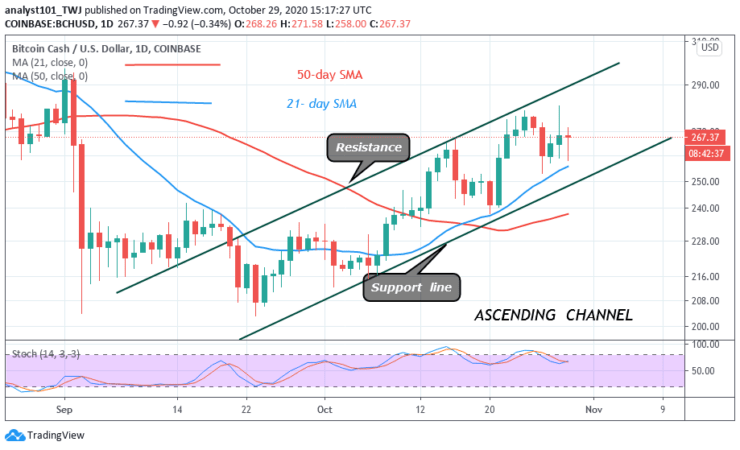
Today, BCH fell to the low at $262 and rebounded. The coin is trading at $267 at the time of writing. On the upside, if buyers continue to sustain the price level above $250, a retest at the $280 overhead resistance is possible. A break above the $280 resistance will propel price to reach a high of $300. The market will resume downward if the bulls fail to sustain a hold above the $250 support. If the price breaks below $250 support, the market will drop to $238 low.
Bitcoin Cash Technical Indicators Reading
BCH is below the 80% range of the daily stochastic. It indicates that the market is in the overbought region. The 21-day SMA and above 50-day SMA are sloping upward indicating the uptrend.
Conclusion
BCH is making an uptrend as it continues to retest the $280 resistance. On October 24 uptrend, BCH was resisted. The retraced candle body tested the 61.8% Fibonacci retracement level. With this retracement, BCH is likely to rise to the 1.618 extension level. In other words, BCH will reach a high of $303.27.
Note: Learn2.Trade is not a financial advisor. Do your research before investing your funds in any financial asset or presented product or event. We are not responsible for your investing results
- Broker
- Min Deposit
- Score
- Visit Broker

- Award-winning Cryptocurrency trading platform
- $100 minimum deposit,
- FCA & Cysec regulated

- 20% welcome bonus of upto $10,000
- Minimum deposit $100
- Verify your account before the bonus is credited
- Fund Moneta Markets account with a minimum of $250
- Opt in using the form to claim your 50% deposit bonus
Learn to Trade
Never Miss A Trade Again

Signal Notification
Real-time signal notifications whenever a signal is opened, closes or Updated

Get Alerts
Immediate alerts to your email and mobile phone.

Entry Price Levels
Entry price level for every signal Just choose one of our Top Brokers in the list above to get all this free.