Key Highlights
BCH is now fluctuating between $430 and $505
The sideways trend is characterized by indecisive small body candlesticks
Bitcoin Cash (BCH) Current Statistics
The current price: $495.88
Market Capitalization: $10,408,023,970
Trading Volume: $5,852,209,328
Major supply zones: $400, $420, $440
Major demand zones: $250, $230, $210
Bitcoin Cash (BCH) Price Analysis January 14, 2021
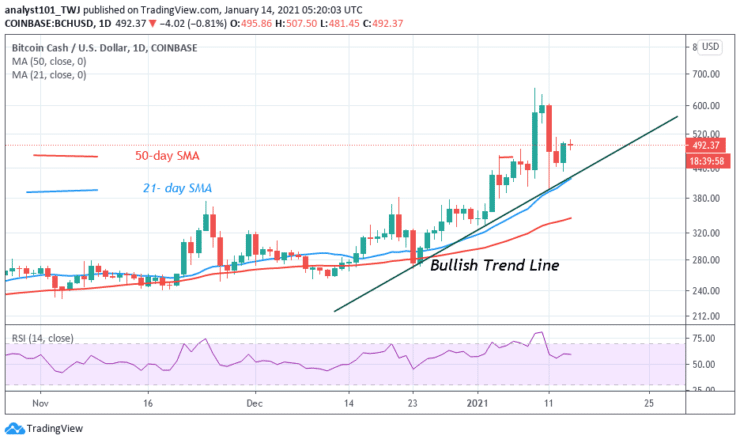
Following the breakdown on January 11, BCH is now in a range-bound movement. Today, the price tested the $505 high and continued the sideways move. On January 12, the altcoin has earlier tested the $505 resistance and was repelled. The coin fell to $433 low. The crypto is fluctuating between levels $430 and $505 price range. Buyers have failed to continue with the uptrend. To resume upside momentum, buyers must break the resistance at $500 and moved up to retest the overhead resistance at $632.
Bitcoin Cash Technical Indicators Reading
After the recent breakdown, the price tested the trend line and rebounded above it. This is an indication of a further upward movement of the coin. However, if price has broken the trend line, BCH will resume a downward move.
Conclusion
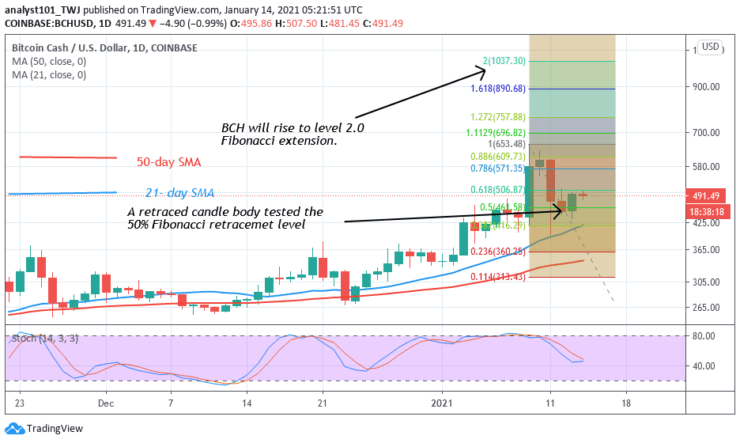
After the recent breakdown, the Fibonacci tool has indicated a further upward movement of the coin. On January 10 uptrend; the retraced candle body tested the 50% Fibonacci retracement level. The retracement indicates that BCH is likely to rise to level 2.0 Fibonacci extensions. That is, BCH will rise to a high of $1,037.30.
Note: Learn2.Trade is not a financial advisor. Do your research before investing your funds in any financial asset or presented product or event. We are not responsible for your investing results
- Broker
- Min Deposit
- Score
- Visit Broker

- Award-winning Cryptocurrency trading platform
- $100 minimum deposit,
- FCA & Cysec regulated

- 20% welcome bonus of upto $10,000
- Minimum deposit $100
- Verify your account before the bonus is credited
- Fund Moneta Markets account with a minimum of $250
- Opt in using the form to claim your 50% deposit bonus
Learn to Trade
Never Miss A Trade Again

Signal Notification
Real-time signal notifications whenever a signal is opened, closes or Updated

Get Alerts
Immediate alerts to your email and mobile phone.

Entry Price Levels
Entry price level for every signal Just choose one of our Top Brokers in the list above to get all this free.