Key Highlights
BCH is range-bound l between $200 and $240
BCH will drop to $180 if the lower price range is breached
Bitcoin Cash (BCH) Current Statistics
The current price: $230.53
Market Capitalization: $4,271,625,399
Trading Volume: $1,617,578,030
Major supply zones: $325, , $350,$375
Major demand zones: $200, $175, $150
Bitcoin Cash (BCH) Price Analysis September 28, 2020
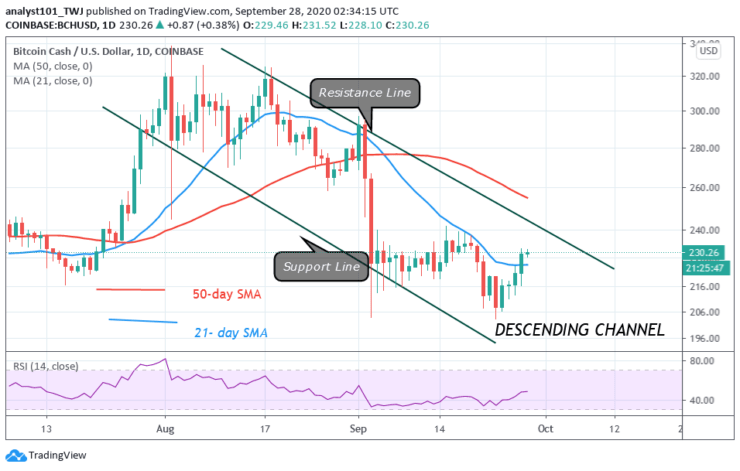
Bitcoin Cash is trading at $228 at the time of writing. This indicates that BCH is still range bound between $200 and $240. The coin will escape the range-bound zone when the key levels are broken. The upside momentum for BCH will resume if buyers push price above $260 high. A possible breakout at $240 will propel price to reach the $260 high.
Bitcoin Cash Technical Indicators Reading
BCH will rise if price completely breaks above the EMAs. The bulls have only broken above the 12-day EMA and price is falling as a result of rejection. The coin is at level 47 of the Relative Strength Index period 14. It indicates that price is in the downtrend zone and below the centerline 50.
Conclusion
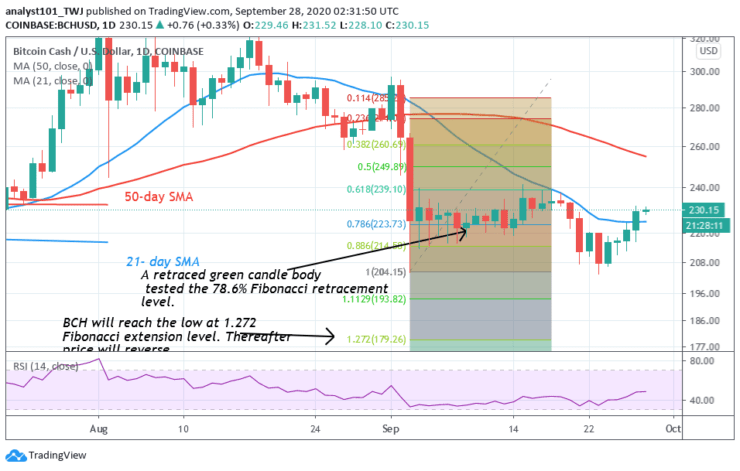
Since the coin is in a range-bound movement the direction is unknown. However, if price breaks the lower price range, the Fibonacci tool analysis is likely to hold. That is the green retraced candle body tested the 78.6% Fibonacci retracement level, BCH will fall at the 1.272 extension or $180 low.
Note: Learn2.Trade is not a financial advisor. Do your research before investing your funds in any financial asset or presented product or event. We are not responsible for your investing results
- Broker
- Min Deposit
- Score
- Visit Broker

- Award-winning Cryptocurrency trading platform
- $100 minimum deposit,
- FCA & Cysec regulated

- 20% welcome bonus of upto $10,000
- Minimum deposit $100
- Verify your account before the bonus is credited
- Fund Moneta Markets account with a minimum of $250
- Opt in using the form to claim your 50% deposit bonus
Learn to Trade
Never Miss A Trade Again

Signal Notification
Real-time signal notifications whenever a signal is opened, closes or Updated

Get Alerts
Immediate alerts to your email and mobile phone.

Entry Price Levels
Entry price level for every signal Just choose one of our Top Brokers in the list above to get all this free.