Key Highlights “
Bitcoin Cash falls to the lower price range at $510
The altcoin may find support and commence the range-bound move
Bitcoin Cash (BCH) Current Statistics
The current price: $522.63
Market Capitalization: $10,975,119,305
Trading Volume: $1,890,375,118
Major supply zones: $700, $720, $740
Major demand zones: $250, $230, $210
Bitcoin Cash (BCH) Price Analysis March 22, 2021
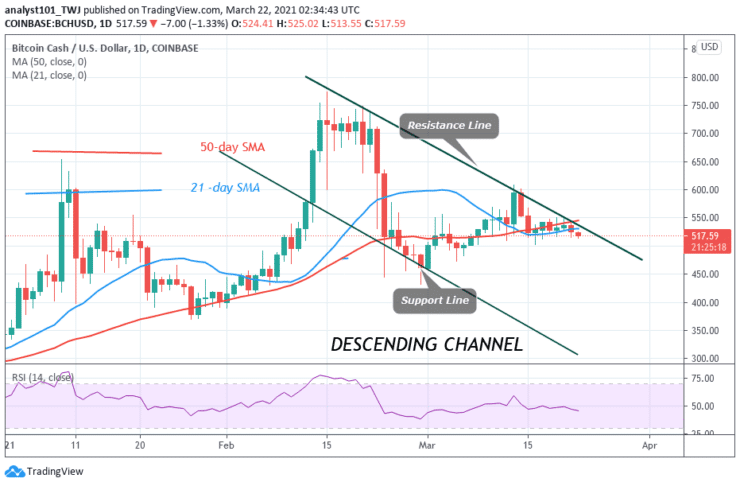
BCH is falling after being repelled at the $550 resistance on March 20. Today, the crypto has reached the low of $517. There is a likelihood of a further downward move. Presently, BCH is range bound between $510 and $550. On the downside, if price finds support above $510, the upward move will resume on the upside. On the other hand, if the bears break the $510 support, the market will decline to $480 low. The range-bound move will resume if price finds support above $510.
Bitcoin Cash Technical Indicators Reading
The crypto’s price has broken below the moving averages which indicate a possible downward move of the coin. BCH has fallen above the 25% range of the daily stochastic but the bands are sloping horizontally. It indicates that the price momentum has been stagnant.
Conclusion
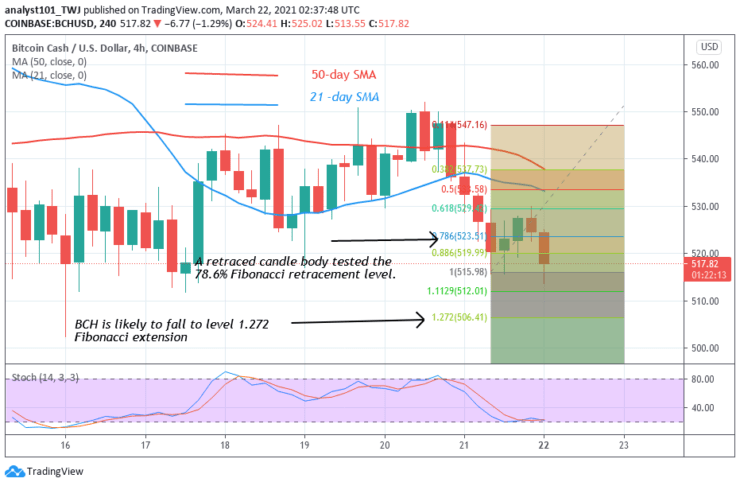
Bitcoin Cash has fallen and it is approaching the lower price range. On March 21 downtrend; a retraced candle body tested the 78.6% Fibonacci retracement level. The retracement indicates that BCH is likely to rise to level 1.272 Fibonacci extension or the low of $506.41.
You can purchase crypto coins here: Buy Coins
Note: Learn2.Trade is not a financial advisor. Do your research before investing your funds in any financial asset or presented product or event. We are not responsible for your investing results
- Broker
- Min Deposit
- Score
- Visit Broker

- Award-winning Cryptocurrency trading platform
- $100 minimum deposit,
- FCA & Cysec regulated

- 20% welcome bonus of upto $10,000
- Minimum deposit $100
- Verify your account before the bonus is credited
- Fund Moneta Markets account with a minimum of $250
- Opt in using the form to claim your 50% deposit bonus
Learn to Trade
Never Miss A Trade Again

Signal Notification
Real-time signal notifications whenever a signal is opened, closes or Updated

Get Alerts
Immediate alerts to your email and mobile phone.

Entry Price Levels
Entry price level for every signal Just choose one of our Top Brokers in the list above to get all this free.