Following the bull run that ended in the BCHUSDT daily market on the 30th of June, subsequent attempts to extend the price upside retracement failed. However, very recently, Price action in the Bitcoin Cash market seems to have found support just above the $220 price mark. Let’s Examine the chances of it presenting the much-anticipated resumption of price upside retracement.
BCH Statistics:
Bitcoin Value Now: $239.10
BCH Market Cap: $4,600,237,048
Bitcoin Circulating Supply: 19,477,194 BCH
Bitcoin Total Supply: 19,477,194 BCH
BCH CoinMarketCap Ranking: 18
Major Price Levels:
Top: $239.10, $245.00, and $250.00
Base: $235.00, $230.00, and $225.00
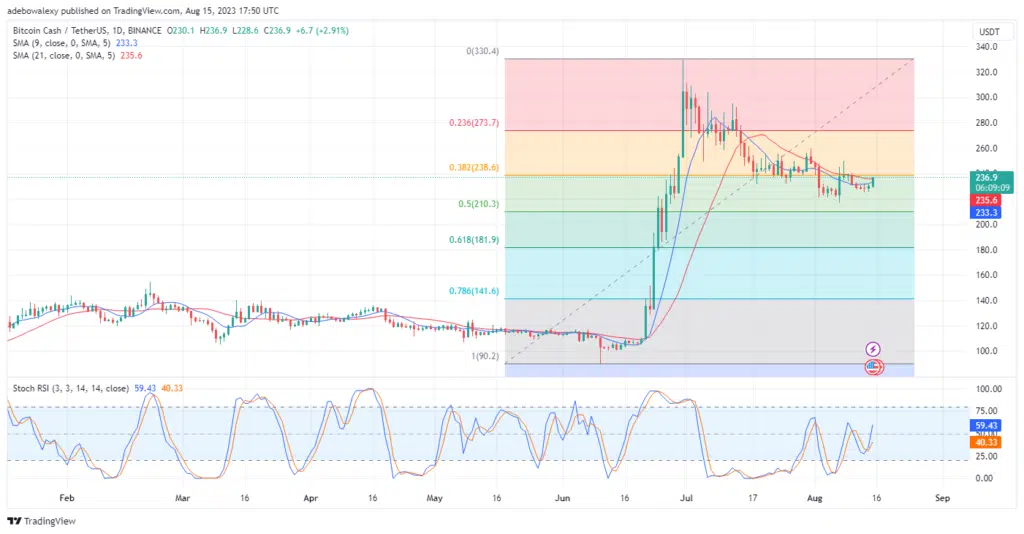
Bitcoin Buyers May Defeat the Resistance at the 38.20 Fibonacci Retracement Level
Following the minimal-price upside correction in the BCHUSDT daily market, a new session has begun with bulls taking the lead. Consequently, the current price of this token has surpassed the 9- and 21-day Simple Moving Average Curves.
Also, the Relative Strength Indicator (RSI) lines are ramping upwards, following a recent crossover clearly above the 25 marks of the indicator. Furthermore, the leading line has risen past the 55 level with a sharp upside bearing. All the perceived signs here have bullish implications for this market.

BCH Eyes the 241.00 Price Level
As can be seen, the upper part of this price candle lacks a shadow, which indicates that buyers are pulling the market in their direction. Additionally, the leading line of the RSI has reached the terminal level of the indicator and continues to trend sideways. Therefore, the ongoing upside correction may extend toward the $241.00 mark.