Don’t invest unless you’re prepared to lose all the money you invest. This is a high-risk investment and you are unlikely to be protected if something goes wrong. Take 2 minutes to learn more
Price activity in the Bitcoin Cash daily market has further increased by an additional 1.70% today. While this may seem like a very small gain, one might want to consider it an attempt to finally breach the $700 mark. However, the market may have to gain more traction to do so, as the resistance seems quite strong at this point.
Bitcoin Cash Statistics:
Current BCH Value: $692.3
Bitcoin Cash Market Cap: $13,617,986,853
Bitcoin Cash Circulating Supply: 19.69 million
BCH Total Supply: 21 million
BCH CoinMarketCap Rank: 13
Key Price Levels:
Resistance: $692.3, $730, and $750
Support: $690, $650, and $600
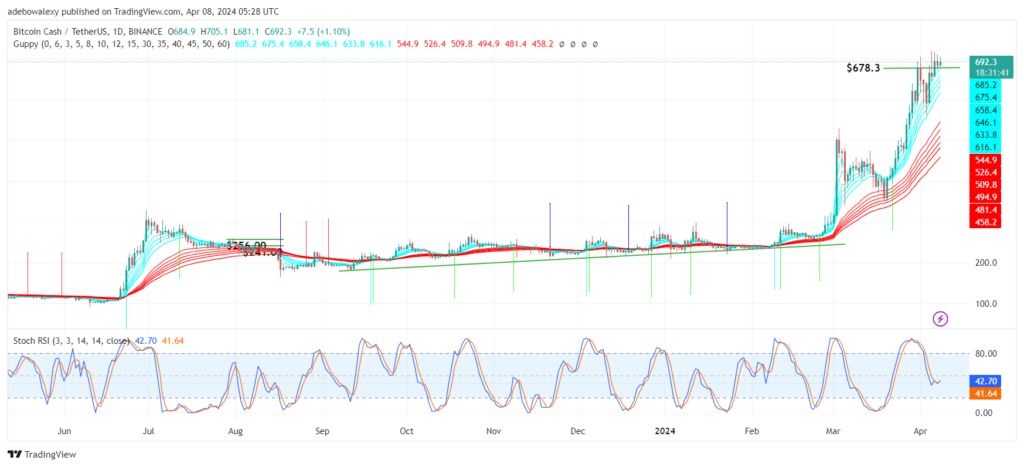
Bitcoin Cash Sustains Trading Above $678.30
For the past three sessions, price activity in the BCH market has surpassed the $670 price level, with the token continuing to trade above that mark. Although the coin hasn’t made much progress afterward, today’s trading activity seems to have started on a positive note.
While the last price candle brought only a small increment, it could be seen to have kept the coin trading above the Guppy Multiple Moving Average (GMMA) lines. Simultaneously, the Stochastic Relative Strength Index (SRSI) lines have an upward trajectory at this point, reflecting the current market trend. Traders can consider placing trades using crypto signals with targets above the $700 mark.
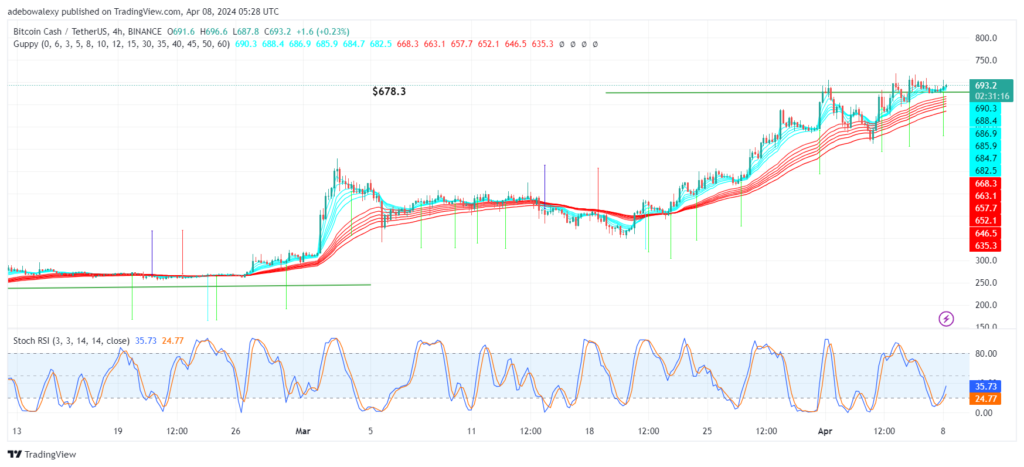
BCH Price Action Smoothly Recoils Off the Newly Found Price Baseline
Continuing this price analysis on the Bitcoin Cash 4-hour market, it is evident that price action has rebounded off the $678.3 mark smoothly and consistently. This suggests that the newly found support may have been successfully defended. If the price candle corresponding to the ongoing session remains green, despite its small appearance, it further confirms the bullish sentiment. Additionally, trading continues above the GMMA indicator lines, maintaining bullish consistency with the daily market. The SRSI indicator lines continue to rise upward out of the oversold region. Based on this, traders in this market may anticipate price movement to break through the $700 mark and approach the $720 mark.
Trade on MT4 with Leverage up to 1:500! Trade on MT4 with Leverage up to 1:500!
X
We use cookies to ensure that we give you the best experience on our website. If you continue to use this site we will assume that you are happy with it.