Key Highlights
BCH is stuck below $600
BCH is also in a sideways trend
Bitcoin Cash (BCH) Current Statistics
The current price: $588.52
Market Capitalization: $12,374,442,289
Trading Volume: $12,374,442,289
Major supply zones: $700, $720, $740
Major demand zones: $250, $230, $210
Bitcoin Cash (BCH) Price Analysis November 1, 2021
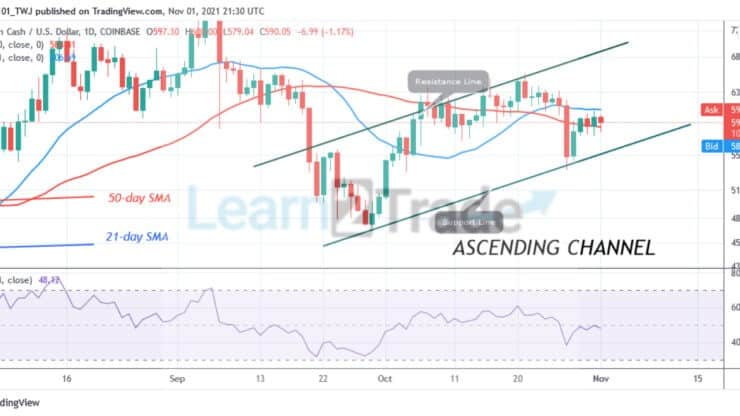
Bitcoin Cash (BCH) is trading in a downward correction below the $600 resistance. Since October 28, the BCH price is fluctuating below the resistance level. If the bulls break the $600 resistance, BCH will rally to $680. However, buyers will have to contend with the minor resistance at $650. In the previous uptrend, BCH was resisted at a $650 high.
Bitcoin Cash Technical Indicators Reading
The crypto’s price is above the 50-day SMA but below the 21-day SMA which indicates a sideways move. BCH is at level 48 of the Relative Strength Index period 14. It indicates that BCH is in the downtrend zone and below the centerline 50. That is, the market is prone to decline on the downside. The cryptocurrency is in a bullish momentum as BCH is above the 50% range of the daily stochastic.
Conclusion
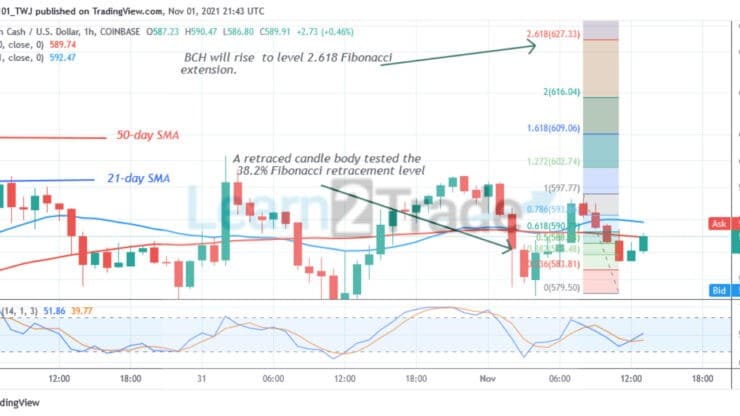
On the 1– hour chart, BCH is in a sideways move. The price fluctuates and retests the resistance level. Meanwhile, on November 1 uptrend; a retraced candle body tested the 38.2% Fibonacci retracement level. The retracement indicates that BCH will rise to level 2.618 Fibonacci extensions or level $627. 33 .
You can purchase crypto coins here: Buy Coins
Note: Learn2.Trade is not a financial advisor. Do your research before investing your funds in any financial asset or presented product or event. We are not responsible for your investing results
- Broker
- Min Deposit
- Score
- Visit Broker

- Award-winning Cryptocurrency trading platform
- $100 minimum deposit,
- FCA & Cysec regulated

- 20% welcome bonus of upto $10,000
- Minimum deposit $100
- Verify your account before the bonus is credited
- Fund Moneta Markets account with a minimum of $250
- Opt in using the form to claim your 50% deposit bonus
Learn to Trade
Never Miss A Trade Again

Signal Notification
Real-time signal notifications whenever a signal is opened, closes or Updated

Get Alerts
Immediate alerts to your email and mobile phone.

Entry Price Levels
Entry price level for every signal Just choose one of our Top Brokers in the list above to get all this free.