Key Support Zones: $7, 000, $6, 000, $5,000
BTC/USD Long-term Trend: Ranging
On February 4, Bitcoin survived the downward move as the coin rebounds after falling to the low of $9,100. For some time, the bulls and bears tussle with the price between the low of $9,200 and the high of $9,600. Neither the bulls nor the bears have broken any of the price levels. The rebound at the low has pushed the price close to the breakout point at $9,600.
It is uncertain whether the bulls will penetrate the resistance at $9,600. There is an indication that the range-bound movement will continue for a few more days. A normal price break will push the price above the overhead resistance. Expectantly, a bullish or bearish break will take Bitcoin out of the range-bound movement.

Daily Chart Indicators Reading:
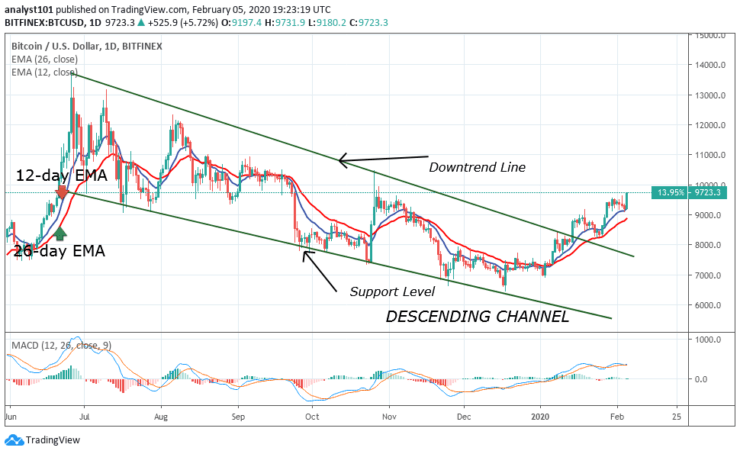
Presently, the MACD line and the signal line are above the zero line which indicate that uptrend is ongoing. Besides that, the price bars are above the 21-day SMA and 50-day SMA indicating that the upward move is continuing. This implies that Bitcoin’s upward move is certain.
BTC/USD Medium-term Trend: Bullish
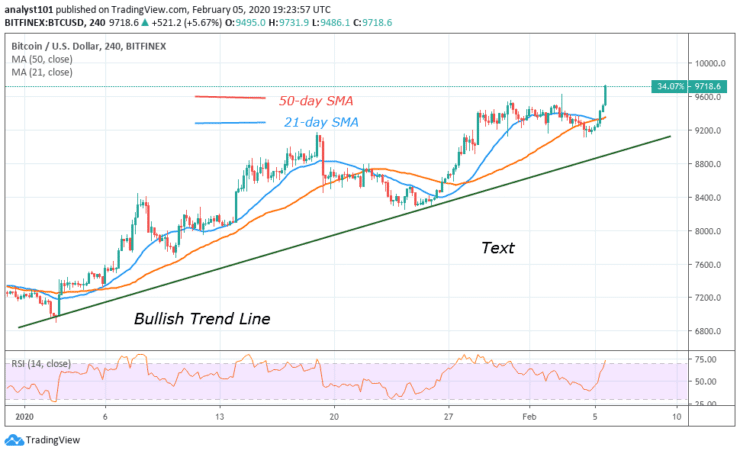
On the 4-hour chart, BTC is in an uptrend as price moves up to the high of $9,600. At the higher price level, BTC is trading in a range as the upward move is hampered. The coin is carefully trading within the price range. Any breakage of this price range will determine the direction of the market.
4-hour Chart Indicators Reading
Bitcoin has moved up to a high of $9,690. In the same vein, the Relative Strength Index period 14 has also moved to level 68 and approaching the overbought region of the market. By the time RSI is above level 70, the current price of Bitcoin may drop again to the lower price range. This explains the fact the bulls are not likely to break the current resistance. In other words, the price range between $9,200 and $9,600 may continue.

General Outlook for Bitcoin (BTC)
The fact is that Bitcoin is still in an uptrend. What determines the next move is the breaking of either $9,200 or $9,600. Bitcoin is now in a stalemate as the price continues its range-bound movement. It is uncertain if the bulls can break the overhead resistance as the price is almost at the overbought region of the market. Sellers will overwhelm the buyers at the breakout point.
BTC Trade Signal
Instrument: BTC/USD
Order: Buy
Entry price: $9,690
Stop: $9,500
Target: $10,300
Note: Learn2Trade.com is not a financial advisor. Do your research before investing your funds in any financial asset or presented product or event. We are not responsible for your investing results
- Broker
- Min Deposit
- Score
- Visit Broker
- Award-winning Cryptocurrency trading platform
- $100 minimum deposit,
- FCA & Cysec regulated
- 20% welcome bonus of upto $10,000
- Minimum deposit $100
- Verify your account before the bonus is credited
- Fund Moneta Markets account with a minimum of $250
- Opt in using the form to claim your 50% deposit bonus
Learn to Trade
Never Miss A Trade Again

Signal Notification
Real-time signal notifications whenever a signal is opened, closes or Updated

Get Alerts
Immediate alerts to your email and mobile phone.

Entry Price Levels
Entry price level for every signal Just choose one of our Top Brokers in the list above to get all this free.


