Bitcoin (BTC) Price Analysis: 4H Chart – Bullish
Key resistance levels: $9550, $9800, $9980, $10350
Key support levels: $9000, $8800, $8500, $8300
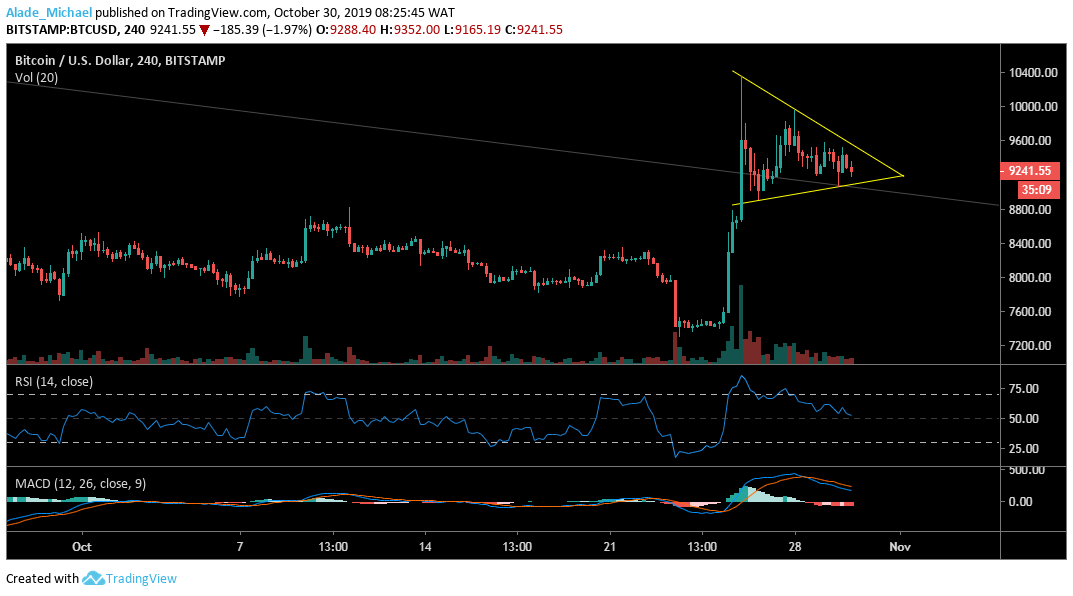
From $9400 zones, Bitcoin has currently shifted its trading to around $9200 zones following a small squeeze over the past three days now. This suggests that the price is at equilibrium due to lack of interest amongst traders. Yesterday, Bitcoin saw a little drop to $9100 before seeing a rebound which is still shaky for an upswing. Nevertheless, the $9500, $9770, $9980 and $10350 are resistance for an upsurge.

Meanwhile, the RSI is still in a downward range but has currently found support at the 50 levels. The MACD moving averages have crossed down to show an ongoing sell, although the market is still positive. However, if Bitcoin plays bearish, we should expect support at $9000, meeting the descending support line (grey). A cross below the grey line might lead BTC to $8800 and back to the last consolidation zone at $8500 and $8300
Bitcoin (BTC) Price Analysis: Hourly Chart – Bullish
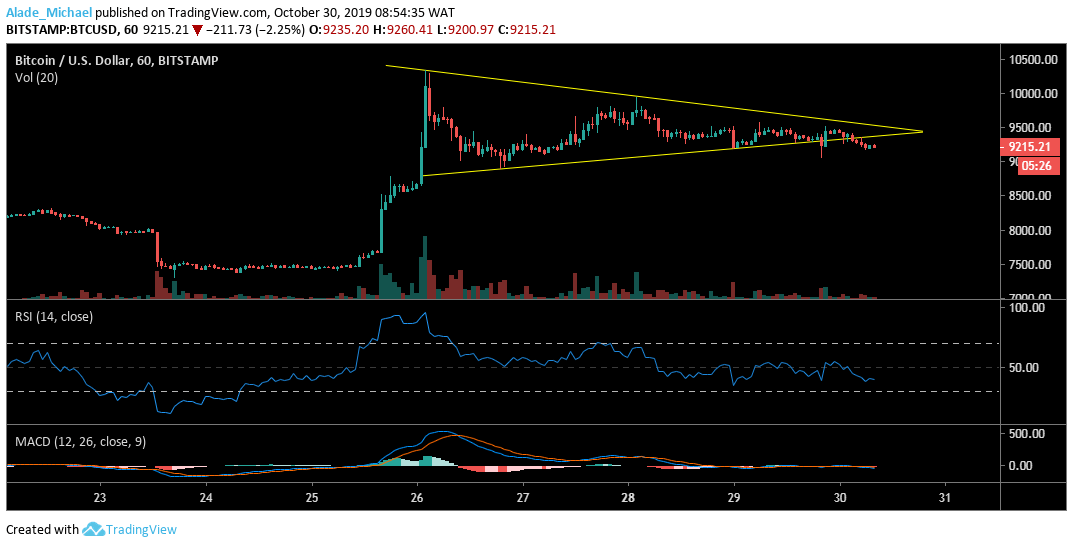
As the $9300 price zones could no longer hold, Bitcoin had stylishly broken the three-day triangle formation to the downside as bearish come-back is at hand. We may see a short opening to $9000 support soon. The $8900 and $8800 support may further follow if the supply turns heavy.

Interestingly, the RSI has now slipped below the 50 level but the MACD is still indecisive at the moment. Meanwhile, we can say the short-term sellers are in play. In case the bulls can defend the $9000 support firmly, we can then expect a quick rebound. However, the important resistance, for now, is $9300, $9500 and $9680.
BITCOIN SELL SIGNAL
Sell Entry: $9277
TP: $9100
SL: $10000
- Broker
- Min Deposit
- Score
- Visit Broker
- Award-winning Cryptocurrency trading platform
- $100 minimum deposit,
- FCA & Cysec regulated
- 20% welcome bonus of upto $10,000
- Minimum deposit $100
- Verify your account before the bonus is credited
- Fund Moneta Markets account with a minimum of $250
- Opt in using the form to claim your 50% deposit bonus
Learn to Trade
Never Miss A Trade Again

Signal Notification
Real-time signal notifications whenever a signal is opened, closes or Updated

Get Alerts
Immediate alerts to your email and mobile phone.

Entry Price Levels
Entry price level for every signal Just choose one of our Top Brokers in the list above to get all this free.


