Bitcoin has been finding it difficult to breach the $9400 resistance over the past days as the $9000 keep holding acting as solid support as well. These price zones mentioned above are important for Bitcoin’s major move in the coming days. Meanwhile, we can expect these zones to break as soon as volatility expansion occurs. As of now, Bitcoin is trading at $9180 after seeing a small price drops.
Bitcoin (BTC) Price Analysis: 4H Chart – Bullish
Key resistance levels: $9600, $9800, $9950
Key support levels: $9000, $8820, $8500
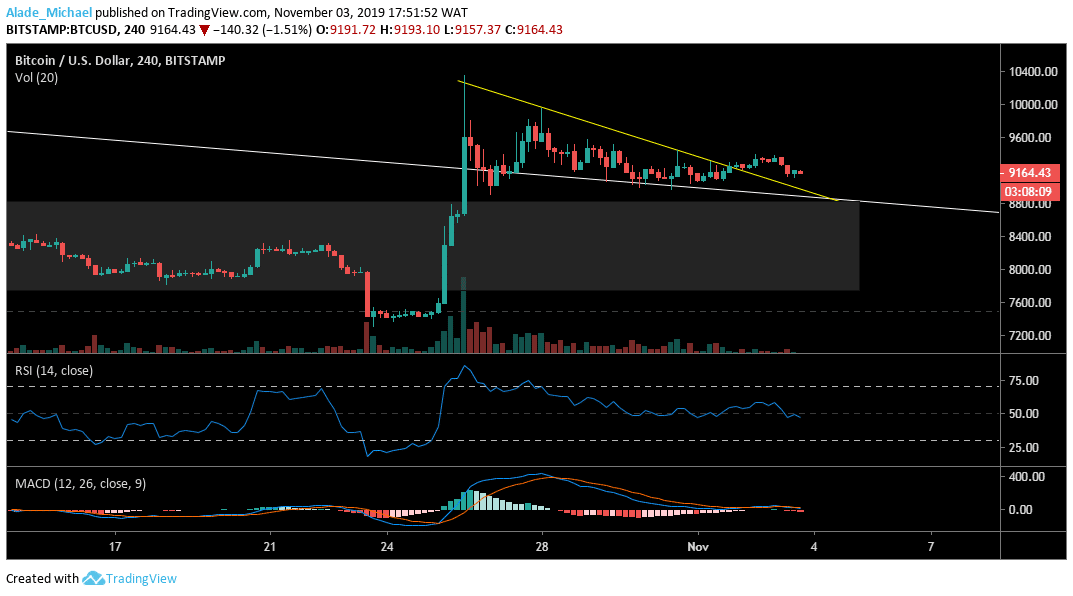
Earlier today, Bitcoin was rejected at $9400 resistance after managing to rebound at the $8961 support on October 31. The mentioned resistance has become a tough area for the long traders to surpass over the past days as Bitcoin now rolling back to the $9100 zones. Currently, BTC is showing a slight weakness in price and with that, we can expect immediate support at $9000, $8820 and $8500.

Moreover, the technical indicators are slowly sloping down to show that the price is weakening. Rising above the $9400 resistance is a good sign for a price gain as the next zones to watch out for is the $9600, $9800 and $9950 on the upside. Meanwhile, Bitcoin’s volatility is low at the moment as there’s a need for a price surge to determine the next actual trend for the market.
Bitcoin (BTC) Price Analysis: Hourly Chart – Neutral
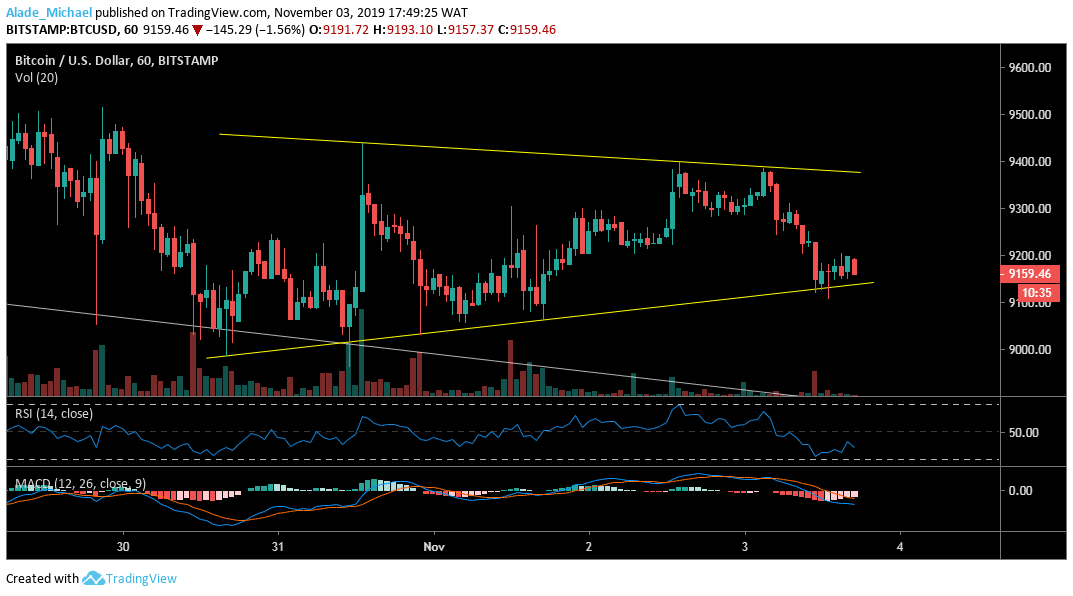
Bitcoin is rounding up for another rally as the market remains inside a symmetrical triangle pattern. Currently, the price is testing the triangle’s support at $9100 after making a double-top formation around the $9400 a few hours ago. Meanwhile, Bitcoin has been indecisive over the last six hours. If the triangle’s lower boundary can produce a rebound, we should expect the price at $9350, meeting the triangle’s upper boundary.

A break-down would bring the market to $9000 and below. A break-up would take the bulls straight to $9600 and above. But looking at the current RSI and MACD indicators, Bitcoin is already bearish as a further dip may cause Bitcoin to drop from the triangle formation. For now, Bitcoin is currently moving sideways.
BITCOIN BUY SIGNAL
Buy Entry: $9180
TP: $9350
SL: $8900
- Broker
- Min Deposit
- Score
- Visit Broker
- Award-winning Cryptocurrency trading platform
- $100 minimum deposit,
- FCA & Cysec regulated
- 20% welcome bonus of upto $10,000
- Minimum deposit $100
- Verify your account before the bonus is credited
- Fund Moneta Markets account with a minimum of $250
- Opt in using the form to claim your 50% deposit bonus
Learn to Trade
Never Miss A Trade Again

Signal Notification
Real-time signal notifications whenever a signal is opened, closes or Updated

Get Alerts
Immediate alerts to your email and mobile phone.

Entry Price Levels
Entry price level for every signal Just choose one of our Top Brokers in the list above to get all this free.


