Bitcoin (BTC) Price Analysis: Daily Chart – Bullish
Key resistance levels: $7800, $8000
Key support levels: $7400, $7200
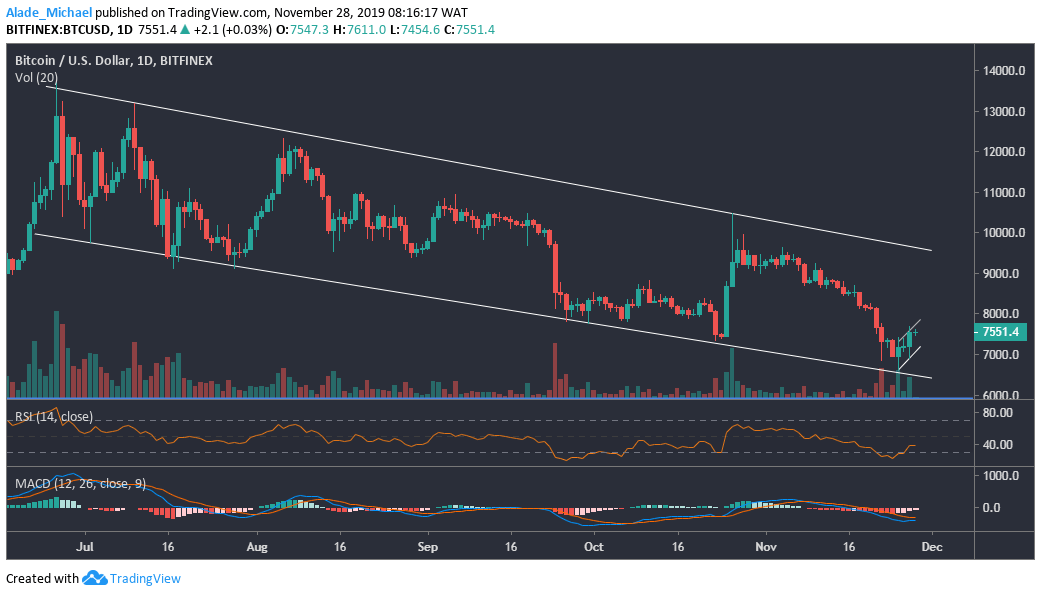
After establishing support at $6600 n November 25, Bitcoin is now bouncing back slowly on the intraday trading. The bullish impulsive move is fueled on a low volume, though a gradual rise should be expected to $9000 in the next few days. Meanwhile, the RSI indicator has now left the oversold region. The bullish move might get strong if Bitcoin climbs above the RSI 50 level.

Currently, BTC next bullish target is $7800, although $8000 may follow in future trading. At the same time, we may see a downward correction to near support at $7400 and $7200. On the daily MACD, the BTC market is still in a bearish zone. A positive crossover would give a boost to the buying pressure in the market.
Bitcoin (BTC) Price Analysis: 30M Chart – Bullish
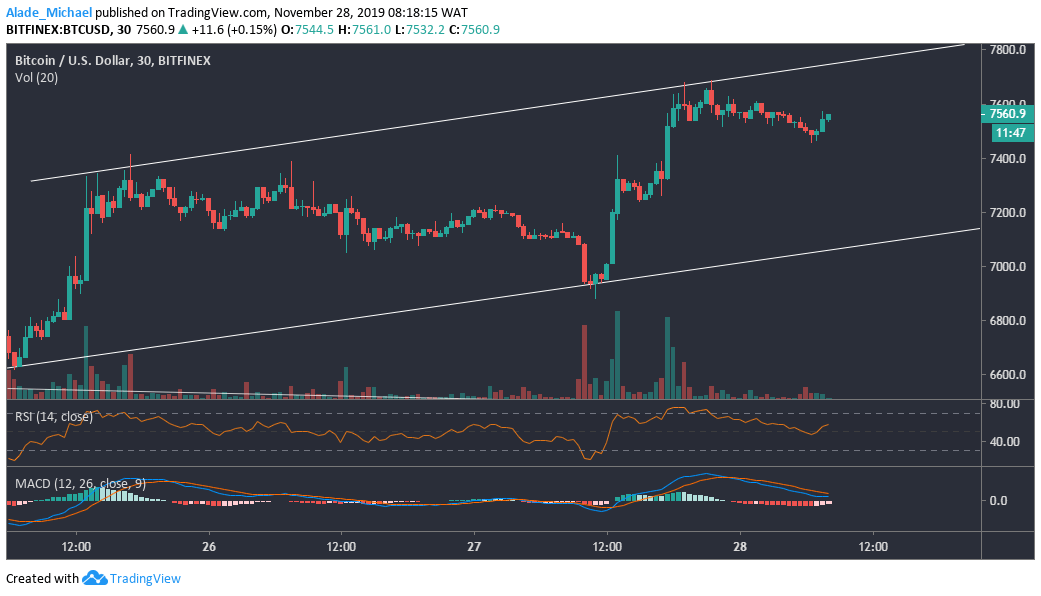
The latest positive has made Bitcoin touch the upper boundary of the channel that is forming on the 30-minutes time frame. As we can see, it appeared that Bitcoin may be retracing to the channel’s lower boundary soon. With that, the market is likely to fall to $7400, $7300 and $7200 support before resuming bullish trajectory. However, if the market moves the other way round, a bullish continuation is mostly likely to occur.

The next level of resistance to look out for is $7700, $7800 and $7900. More importantly, if Bitcoin can find support on the MACD zero level, the bullish play would be guaranteed. Above all, Bitcoin is now sitting on the RSI mid-band, facing upward direction. It may play out if the RSI level can hold
BITCOIN SELL SIGNAL
Sell Entry: $7549
TP: $7422 / $7244
SL: 7617
- Broker
- Min Deposit
- Score
- Visit Broker
- Award-winning Cryptocurrency trading platform
- $100 minimum deposit,
- FCA & Cysec regulated
- 20% welcome bonus of upto $10,000
- Minimum deposit $100
- Verify your account before the bonus is credited
- Fund Moneta Markets account with a minimum of $250
- Opt in using the form to claim your 50% deposit bonus
Learn to Trade
Never Miss A Trade Again

Signal Notification
Real-time signal notifications whenever a signal is opened, closes or Updated

Get Alerts
Immediate alerts to your email and mobile phone.

Entry Price Levels
Entry price level for every signal Just choose one of our Top Brokers in the list above to get all this free.


