Bitcoin (BTC) Price Analysis: Daily Chart – Bullish
Key resistance levels: $9800, $10000, $10350
Key support levels: $9200, $9000, $8820
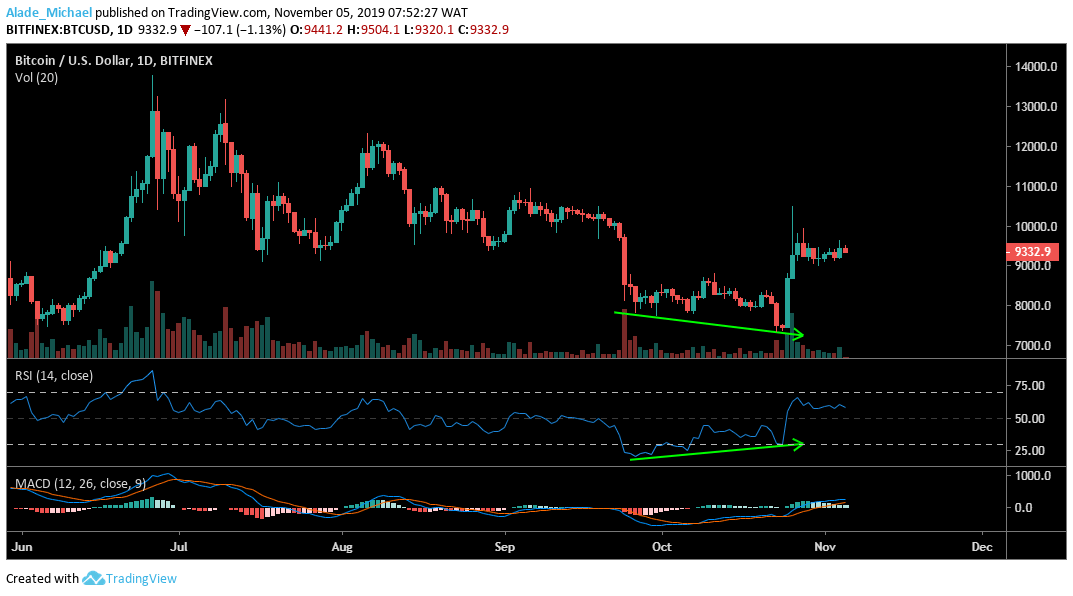
Yesterday, Bitcoin managed to close above the $9400 to show the market is preparing for another bullish phase. This time, it may take us to $12000 but we need to clear the October 27 high at $10350 before we can validate a stronger surge. If Bitcoin can close well above $9500 today, $9800 and $10000 will be in view. Further resistance above lies at $10350.

For now, support to look out for is $9200 and $9000. Support below lies at $8820 and beyond. Another thing to note here is the RSI and the MACD which has signalled a bullish divergence for Bitcoin. We can expect more bullish sentiment to come into play in future trading.
Bitcoin (BTC) Price Analysis: Hourly Chart – Bullish
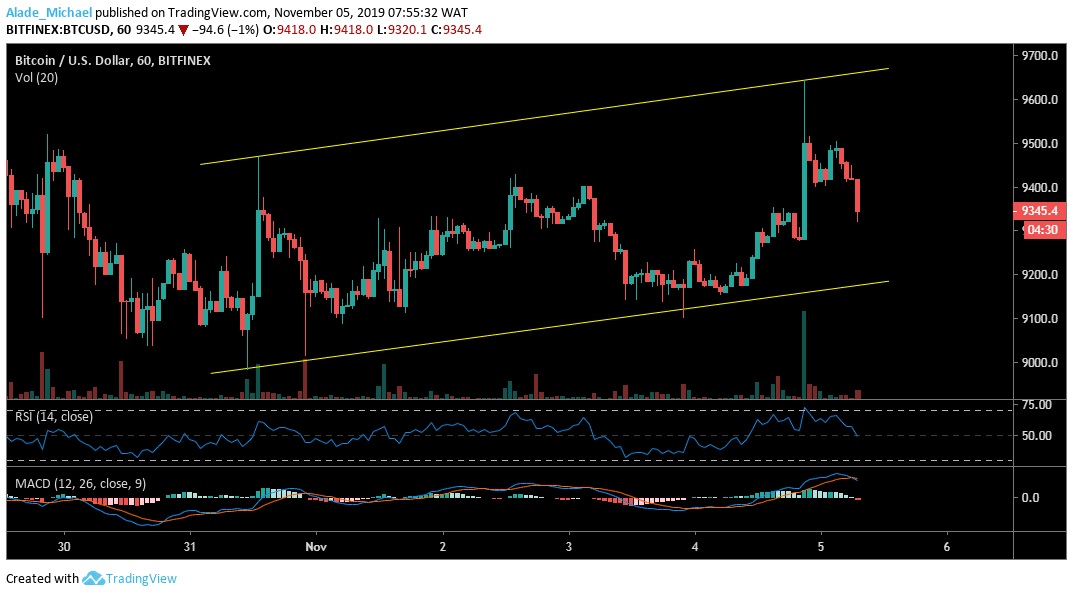
The last 24-hours rise has allowed Bitcoin to record a weekly high of $9644 after breaching the four days triangle pattern. As we can see on the hourly chart, BTC is constructing a new ascending channel which may take Bitcoin us to $10000 in the next rally. Currently, the market is retracing back toward the channel’s support at $9200 –$9100. Meanwhile, the $9000 – $8900 zones could serve as support if a channel break-down occurs.

Bouncing off the channel’s lower boundary would trigger a bullish impulsive move to $9350, $9500 and $9700 resistance. The RSI is bullish but now positioned in a downward direction. The MACD moving averages are now crossing to signal a potential sell, although remain positive at the moment.
BITCOIN SELL SIGNAL
Sell Entry: $9378
TP: $9189
SL: $9500
- Broker
- Min Deposit
- Score
- Visit Broker
- Award-winning Cryptocurrency trading platform
- $100 minimum deposit,
- FCA & Cysec regulated
- 20% welcome bonus of upto $10,000
- Minimum deposit $100
- Verify your account before the bonus is credited
- Fund Moneta Markets account with a minimum of $250
- Opt in using the form to claim your 50% deposit bonus
Learn to Trade
Never Miss A Trade Again

Signal Notification
Real-time signal notifications whenever a signal is opened, closes or Updated

Get Alerts
Immediate alerts to your email and mobile phone.

Entry Price Levels
Entry price level for every signal Just choose one of our Top Brokers in the list above to get all this free.


