Bitcoin (BTC) Price Analysis: Weekly Chart – Bearish
Key resistance levels: $8880, $9000, $9200
Key support levels: $8500, $8300, $8100
Bitcoin is looking bearish on the weekly chart, although it’s a necessary pullback which is likely to resume buying soon. But looking at the previous candle close, the bearish setup is just building up. We may see a weekly close of $8100 if the selling pressure elapses. Meanwhile, Bitcoin held immediate support at $8300 which could be the next selling target.
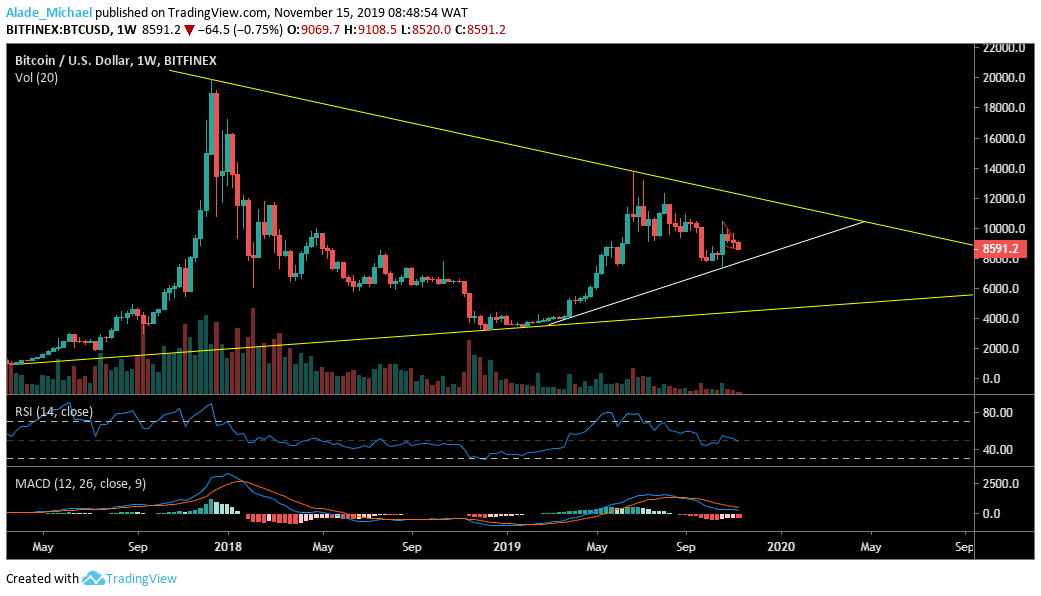
However, if the new support ($8500) can hold well, BTC could look for resistance around the $8800. Still, we need a weekly close above the $9000 resistance before we can validate a positive move. Once we clear the resistance, Bitcoin might reach $12000 in a couple of days. Currently, the technical indicators are on the downside, suggesting a bearish continuation.
Bitcoin (BTC) Price Analysis: Hourly Chart – Bearish
Looking at the hourly chart, Bitcoin is undergoing a lot of bearish pressure over the past few days. The latest price drop has made BTC to now trade in the $8500 zone. It appeared the market is looking for support around the $8000. It may take a few days for Bitcoin to reach this support due to the recent slow movement in price.
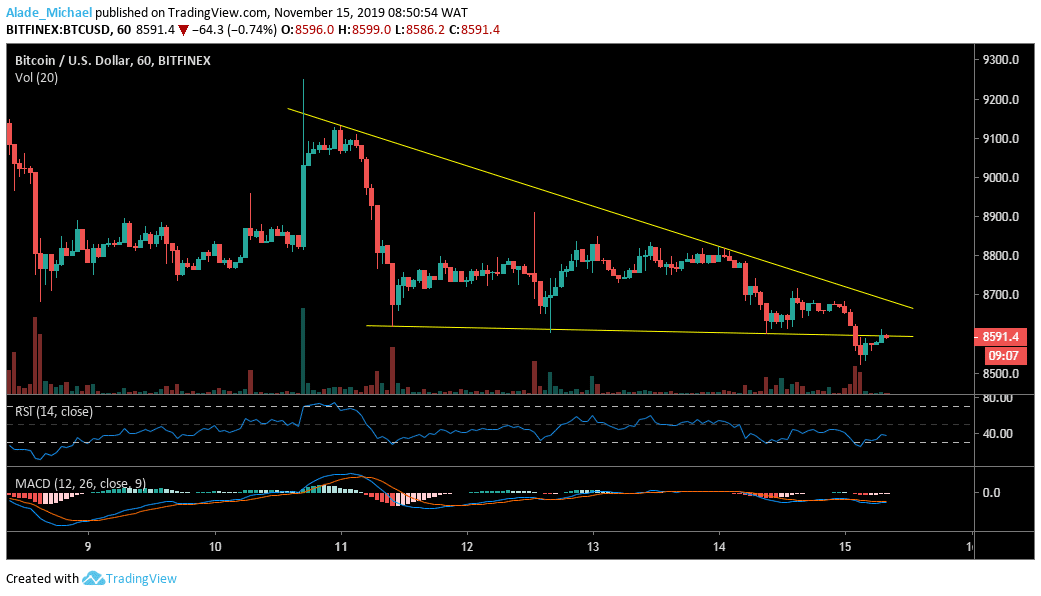
However, $8400 and $8300 may come in play soon. On the upside, there’s no bullish sign for BTC at the moment. Nevertheless, the $8700 and $8800 resistance may be explored if the bulls can push well. The technical RSI and MACD are defiantly bearish to show that Bitcoin is weak at the moment.
BITCOIN SELL SIGNAL
Sell Entry: $8688
TP: $8515 / $8444
SL: 8750
- Broker
- Min Deposit
- Score
- Visit Broker

- Award-winning Cryptocurrency trading platform
- $100 minimum deposit,
- FCA & Cysec regulated

- 20% welcome bonus of upto $10,000
- Minimum deposit $100
- Verify your account before the bonus is credited
- Fund Moneta Markets account with a minimum of $250
- Opt in using the form to claim your 50% deposit bonus
Learn to Trade
Never Miss A Trade Again

Signal Notification
Real-time signal notifications whenever a signal is opened, closes or Updated

Get Alerts
Immediate alerts to your email and mobile phone.

Entry Price Levels
Entry price level for every signal Just choose one of our Top Brokers in the list above to get all this free.