Bitcoin (BTC) Price Analysis: Hourly Chart – Bearish
Key resistance levels: $8300, $8400
Key support levels: $8000, $7800
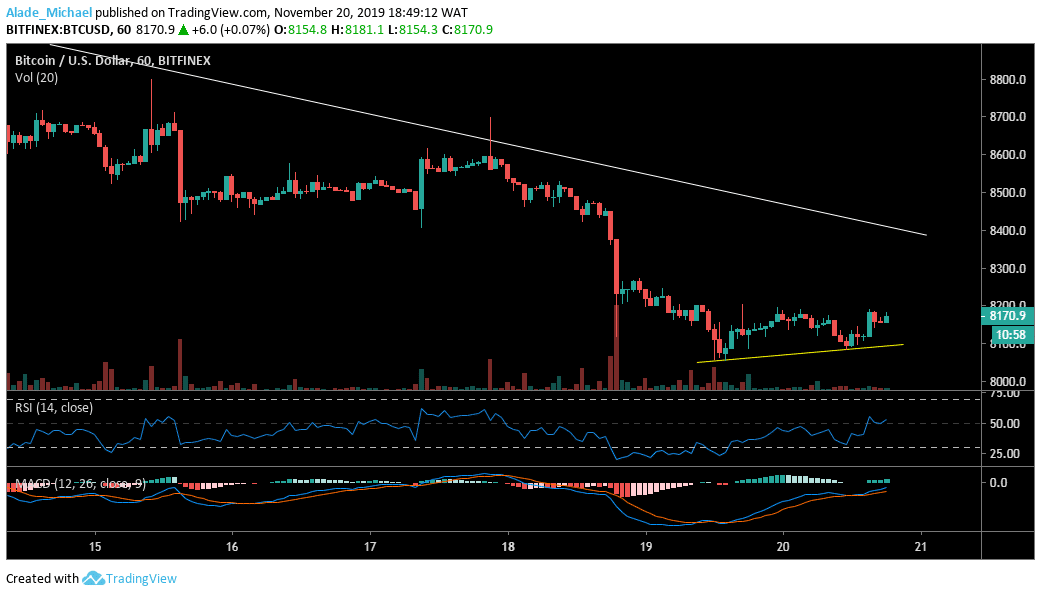
On the hourly, a double-bottom pattern was spotted a few hours ago, which has brought Bitcoin’s price a bit up to $8170 at the moment. It may take BTC price to $8300 and $8400 resistance levels if the bullish formation plays out, although the market seems to be getting weary of the bearish moment. Meanwhile, the buyers have been recently responsive to price actions.

A bearish bounce at the white descending resistance at $8400 could lead to another bearish shock as the market may sell to $8000 support again. More so, Bitcoin may find new support at $7800 if the supply becomes heavy. The recent rise on the relative strength index shows that BTC is recovering. Additionally, the MACD is now climbing back from the negative to show a bull sign.
Bitcoin (BTC) Price Analysis: 15M Chart – Bullish
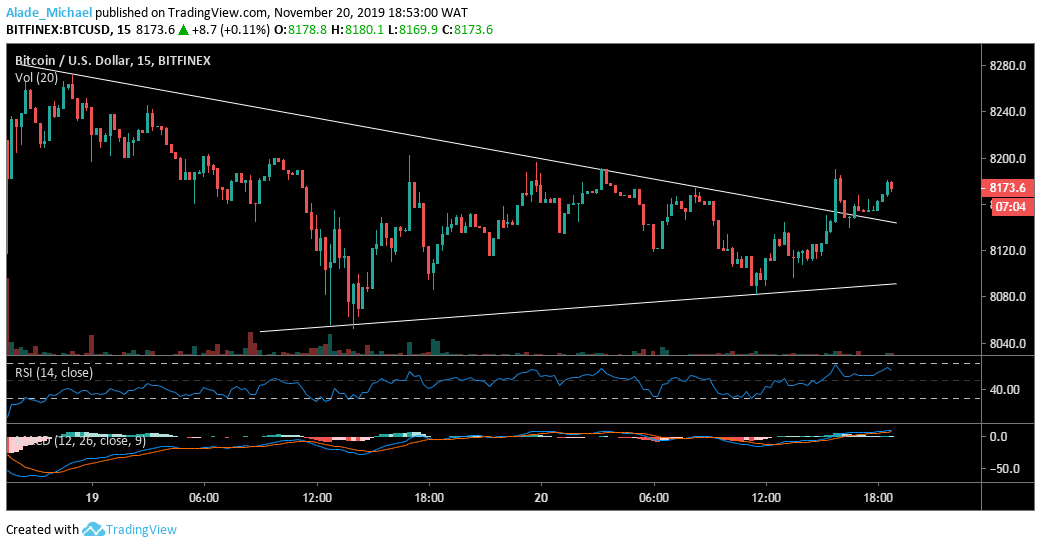
On the 15-minutes time frame, Bitcoin slightly broke through the triangle pattern that has kept the market under bearish pressure for a while. As we can see, the buyers are stepping back on a short-term. It’s important to note that the bearish reaction is still significant in the market. Taking advantage of the bullish correction, Bitcoin may reclaim $8300 if we can close above $8200 today.

Though, the technical indicators are now flying in the bullish zones. Bitcoin’s price is more likely to increase significantly in the next few hours. Considering the wedge breakout, Bitcoin’s price range is expected to add up by $200 from the break level, which is approximated at $8350. Currently, Bitcoin is gearing up for the next move as the buyers look for a progressive level of resistance.
BITCOIN BUY SIGNAL
Buy Entry: $8127
TP: $8300
SL: 7988
- Broker
- Min Deposit
- Score
- Visit Broker
- Award-winning Cryptocurrency trading platform
- $100 minimum deposit,
- FCA & Cysec regulated
- 20% welcome bonus of upto $10,000
- Minimum deposit $100
- Verify your account before the bonus is credited
- Fund Moneta Markets account with a minimum of $250
- Opt in using the form to claim your 50% deposit bonus
Learn to Trade
Never Miss A Trade Again

Signal Notification
Real-time signal notifications whenever a signal is opened, closes or Updated

Get Alerts
Immediate alerts to your email and mobile phone.

Entry Price Levels
Entry price level for every signal Just choose one of our Top Brokers in the list above to get all this free.


