Bitcoin (BTC) Price Analysis: Daily Chart – Bearish
Key resistance levels: $7700, $8000
Key support levels: $7200, $7000
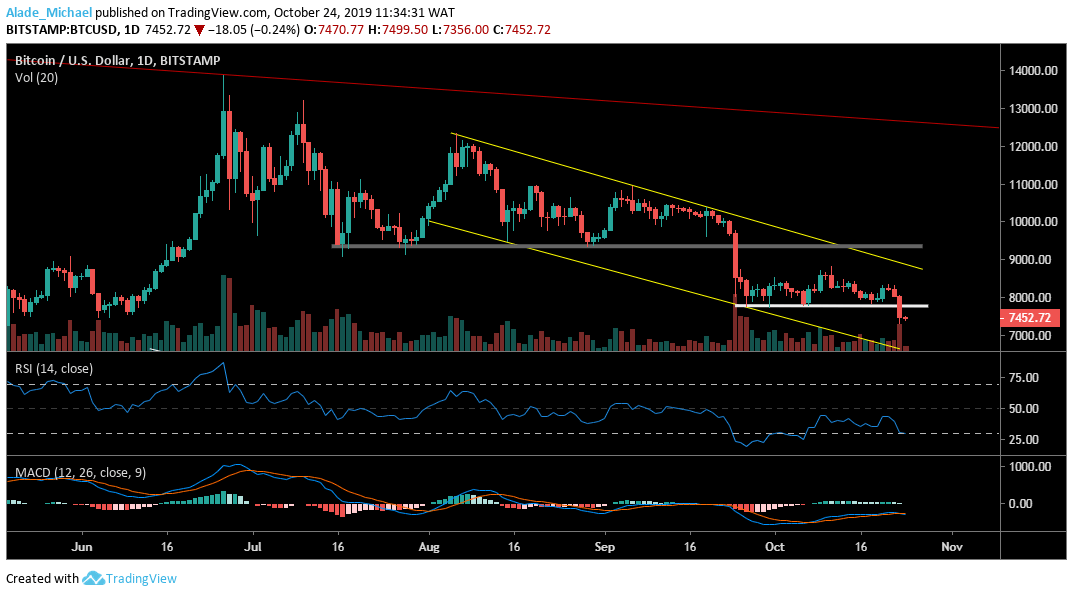
After mounting support at $7700 earlier this month, Bitcoin bounced off, followed by rejection at $8800 while attempting to retest the $9000, which has now become a history for the bulls. Yesterday, Bitcoin fell sharply beneath the $7700 support to $7300, which is now the current support.

Meanwhile, the price seems to be heading towards the lower boundary of the channel pattern to make BTC completes lower lows and lower highs move on the daily chart. We should expect to base at $7200-$7000 support zone if the price drops beneath $7300.
The crypto trading signals that Bitcoin is currently meeting support on the RSI 30 levels. We can expect the price to retest the recently break level at $7700. A Further rise may allow the bulls to see the $8000 resistance once more. However, the MACD suggests that the market is now in the negative zone.
Bitcoin (BTC) Price Analysis: 4H Chart – Bearish
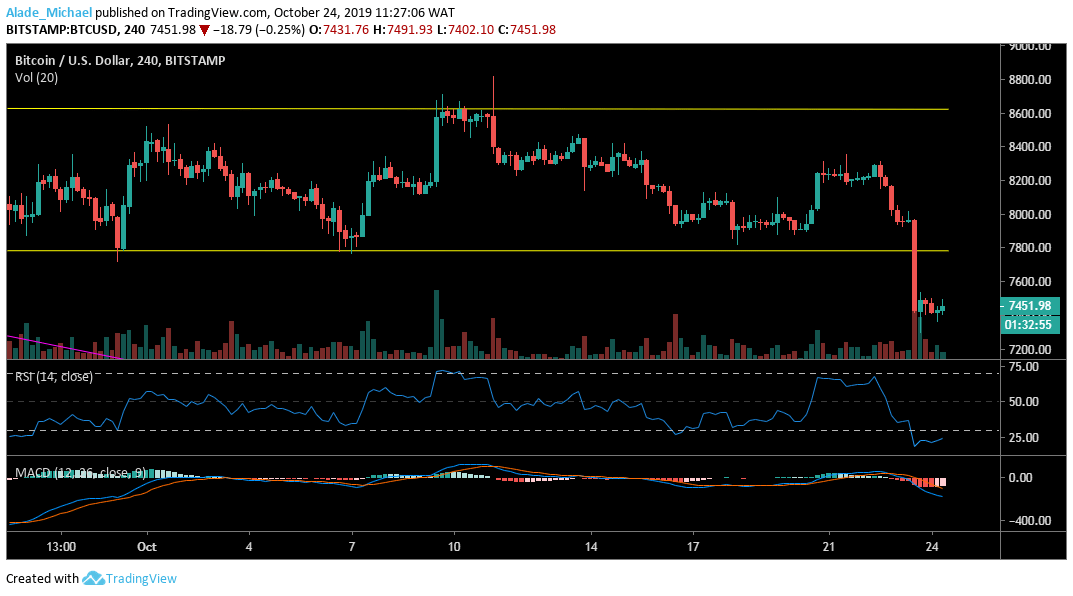
Yesterday, Bitcoin left the $7700 price zone after dropping violently from the four weeks channel pattern. The market is now subdued with choppy price actions after finding support at $7300. If the Bitcoin can show a little strength, we can expect a price recovery $7600 and $7800 resistance, although the bulls are still struggling to overcome the $9500.

The aftermath of the recent bearish actions has slipped the technical indicator (RSI and MACD) to their lowest condition, indicating an undervalued market for Bitcoin. In view of this, selling pressure may reoccur to near support at $7300, $7200 and $7100
BITCOIN SELL SIGNAL
Sell Entry: $7451
TP: $7207 / $7033
SL: $7568
- Broker
- Min Deposit
- Score
- Visit Broker
- Award-winning Cryptocurrency trading platform
- $100 minimum deposit,
- FCA & Cysec regulated
- 20% welcome bonus of upto $10,000
- Minimum deposit $100
- Verify your account before the bonus is credited
- Fund Moneta Markets account with a minimum of $250
- Opt in using the form to claim your 50% deposit bonus
Learn to Trade
Never Miss A Trade Again

Signal Notification
Real-time signal notifications whenever a signal is opened, closes or Updated

Get Alerts
Immediate alerts to your email and mobile phone.

Entry Price Levels
Entry price level for every signal Just choose one of our Top Brokers in the list above to get all this free.


