Bitcoin (BTC) Price Analysis: Daily Chart – Bullish
Key resistance levels: $9550, $9950, $10350
Key support levels: $9000, $8820, $8500, $8300
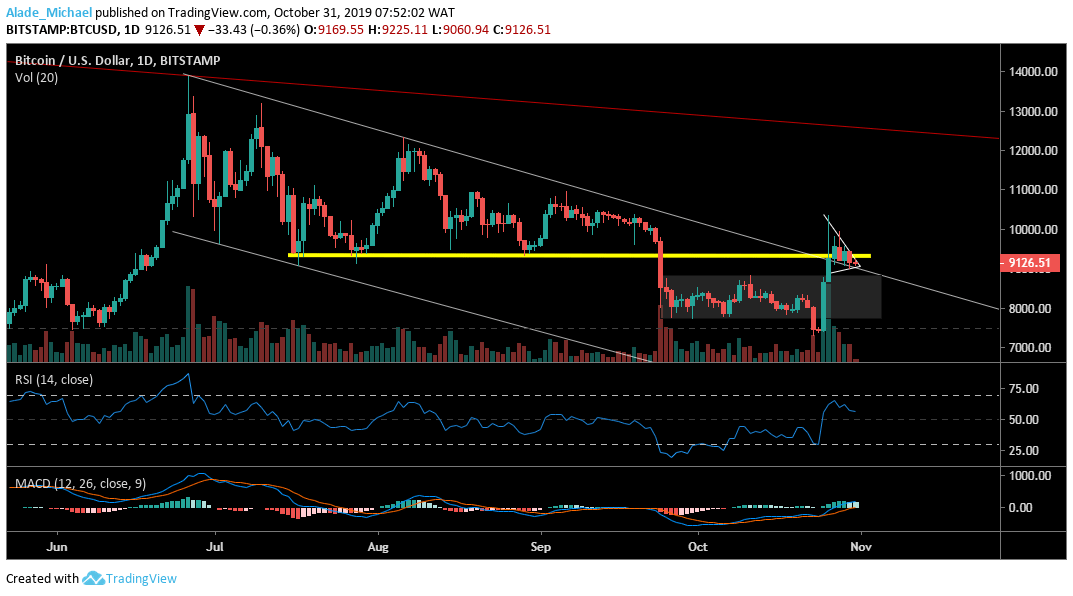
Bitcoin’s daily candle has continued to close above the $9000 to show that the bulls are protecting their territory. Meanwhile, the bears are not relenting to take the price out of the $9000 zone. Fortunately, the bulls are strongly active as they target resistance at $9550, $9950 and $10350 in the next bullish run but they need to clear the $9350 resistance.

We can see that the RSI is showing a sign of strength. Despite the recent market scenario, the MACD is yet to validate a positive move which stalls the bullish continuation at the moment. If Bitcoin fails to provide a bullish crossover, the $9000 may turn weak as price may fall to the $8000 zones. For such a bearish move to occur, the $8820, $8600 and $8350 may be explored.
Bitcoin (BTC) Price Analysis: Hourly Chart – Bullish
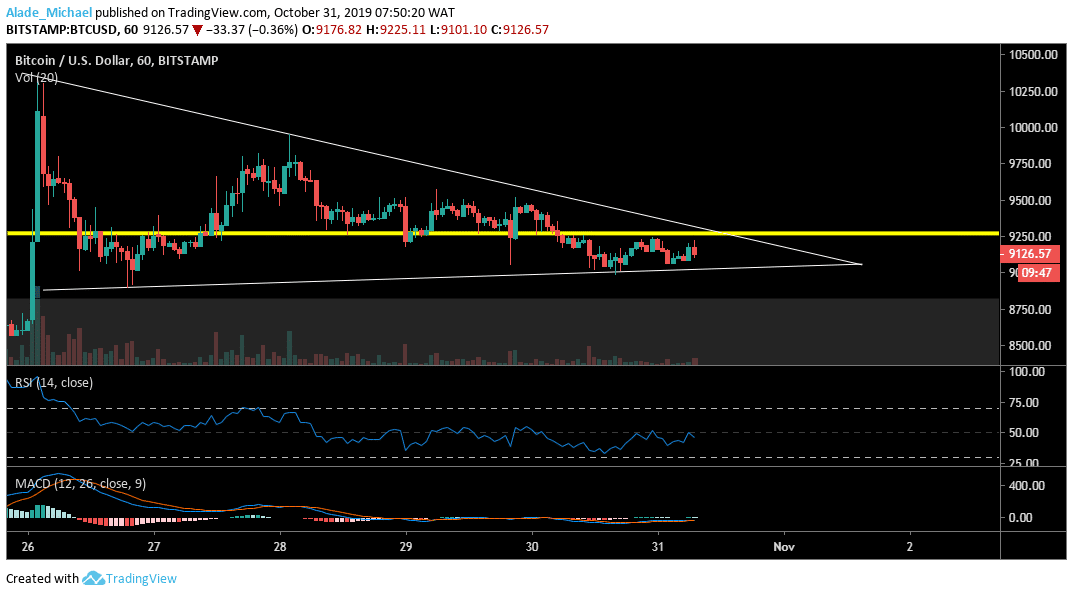
The last 24-hours trading has produced a double-bottom pattern for Bitcoin on the hourly chart. This pattern may lead to massive buy if a break is confirmed above the yellow horizontal resistance ($9300). This time, Bitcoin price may hit $12000 but the closest resistance, for now, is $9500, $9750, $10000 and above. As we can see, the MACD indicator is giving a bullish sign but waiting for confirmation.

Meanwhile, the market has found support at the RSI 50 level after a four days decline. Now, the buyers are getting ready for a perfect entry. However, if the bullish signal turns false, Bitcoin may break-down the descending triangle at $9000 support to $8800, $8600 and $8400, back in the grey consolidation box. Nevertheless, the bulls are currently defending their last defensive line on the $9000 zones.
BITCOIN BUY SIGNAL
Buy Entry: $9070
TP: $9512
SL: $8900
- Broker
- Min Deposit
- Score
- Visit Broker
- Award-winning Cryptocurrency trading platform
- $100 minimum deposit,
- FCA & Cysec regulated
- 20% welcome bonus of upto $10,000
- Minimum deposit $100
- Verify your account before the bonus is credited
- Fund Moneta Markets account with a minimum of $250
- Opt in using the form to claim your 50% deposit bonus
Learn to Trade
Never Miss A Trade Again

Signal Notification
Real-time signal notifications whenever a signal is opened, closes or Updated

Get Alerts
Immediate alerts to your email and mobile phone.

Entry Price Levels
Entry price level for every signal Just choose one of our Top Brokers in the list above to get all this free.


