Bitcoin (BTC) Price Analysis: 4H Chart – Bearish
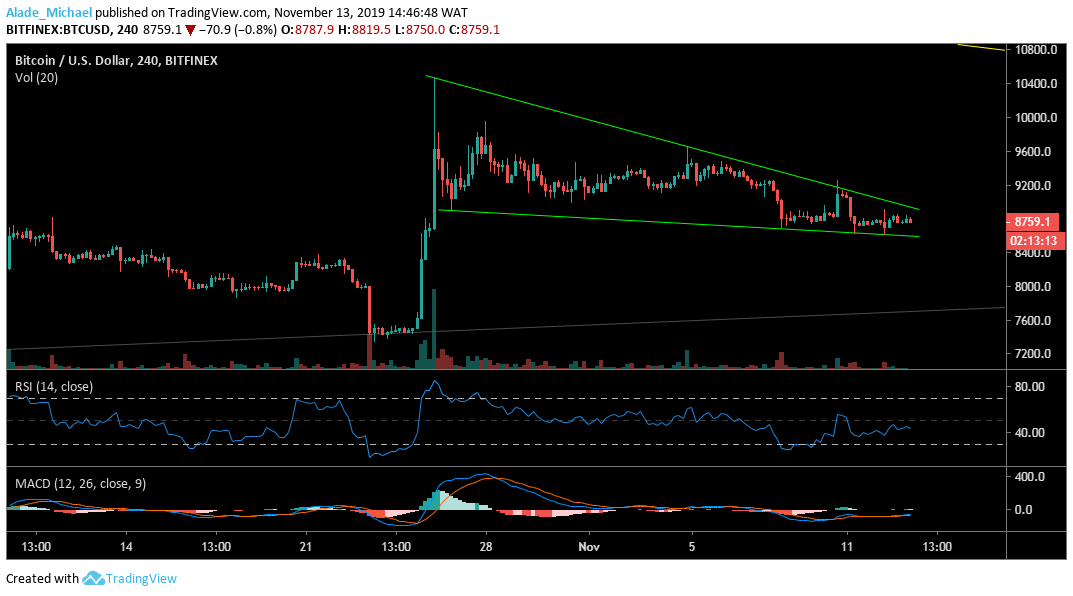
Key resistance levels: $9000, $9600, $9995, $10350
Key support levels: $8600, $8400, $8200, $8000
Bitcoin should be breaking out of the triangle formation any time from now. As we can see now, the price has squeezed so much to a tight angle on the descending triangle. A price explosion could be underway. Traditionally, this pattern formation commonly follows a bullish impulsive move. The expected price range is $10350, although Bitcoin would meet $9000, $9600 and $9995 on the way up.

Interestingly, the RSI is currently showing a positive sign despite the recent bearish actions. On the MACD, the bears are still assuming control of the BTC market. If the $9000 resistance continues to prove difficult, Bitcoin may slip to $8400, $8200 and $8000 after reaching the triangle’s support at $8600.
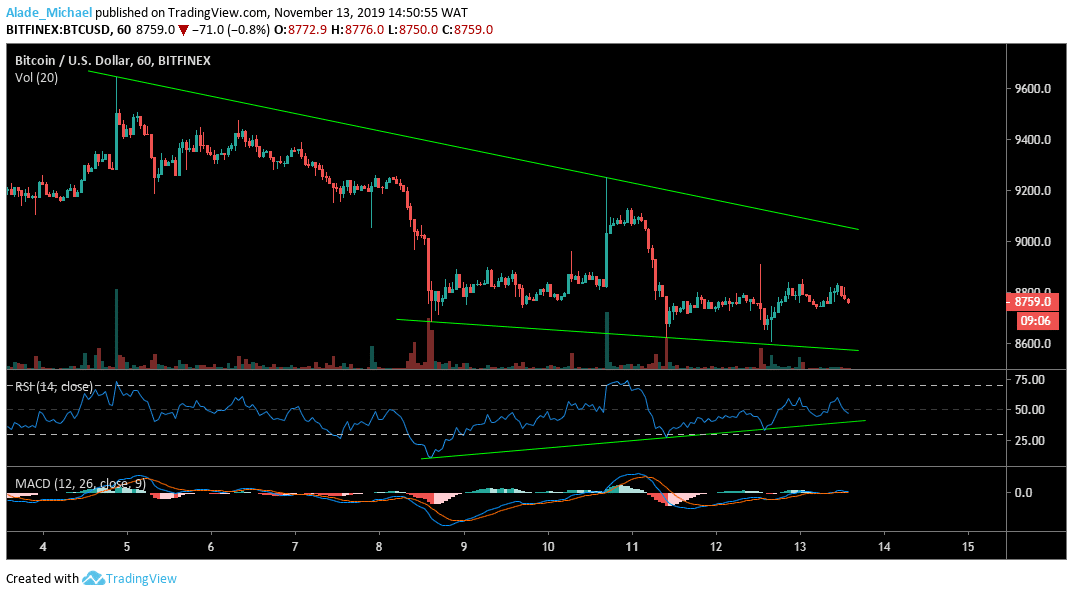
Bitcoin (BTC) Price Analysis: Hourly Chart – Bearish
Overcoming the $8880 resistance has become tough for the buyers since the weekly opening. This level of resistance is as crucial to the bull as to the bears. A look at the technical indicators suggested that there’s a high chance for the bulls to win the $8880 zone, especially the $9000 before surging price to $9200, $9400 and $9600, above the wedge pattern.

That is if the MACD can confirm a positive cross. Also, the RSI needs to keep respecting the green diagonal support which has been playing since November 8. A drive beneath the RSI support could cause a heavy sell-off, although Bitcoin may continue to locate support on the wedge’s lower boundary. Currently, the $8600 remains major support for Bitcoin.
- Broker
- Min Deposit
- Score
- Visit Broker
- Award-winning Cryptocurrency trading platform
- $100 minimum deposit,
- FCA & Cysec regulated
- 20% welcome bonus of upto $10,000
- Minimum deposit $100
- Verify your account before the bonus is credited
- Fund Moneta Markets account with a minimum of $250
- Opt in using the form to claim your 50% deposit bonus
Learn to Trade
Never Miss A Trade Again

Signal Notification
Real-time signal notifications whenever a signal is opened, closes or Updated

Get Alerts
Immediate alerts to your email and mobile phone.

Entry Price Levels
Entry price level for every signal Just choose one of our Top Brokers in the list above to get all this free.


