Bitcoin (BTC) Price Analysis: Daily Chart – Bearish
Key resistance levels: $7600, $7900
Key support levels: $7000, $6800
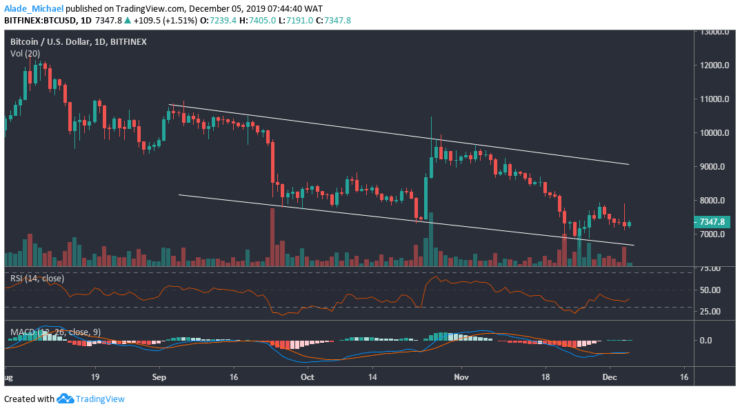
The daily chart for Bitcoin is showing a downward trend as sellers appeared to be holding $7900 resistance which is the last defence line for the short-term bears. After spiking upward yesterday, BTC closed with an evening star candle to indicate a coming sell-off. Though, the bearish signal would be valid if the price closes below $7000 support today. The market may further slip to $6800 support in future.

Inversely, reclaiming the $76000 resistance could allow Bitcoin to retest $7900 once more. While the Bitcoin is still trading well above the RSI oversold level, the price is currently indecisive on the MACD indicator. The market may reach the channel’s upper boundary if the technical indicators keep climbing.
Bitcoin (BTC) Price Analysis: Hourly Chart – Bearish
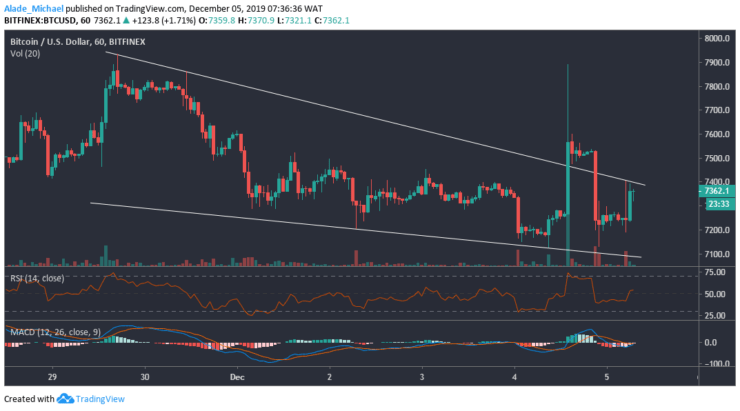
The last 24-hours surge fakeout on the descending wedge was due to significant volatility. As we can see on the hourly chart, Bitcoin is now trading back inside the wedge. Currently, the price of BTC is testing the channel’s resistance at $7362. Even though we saw a false break yesterday, the market is reaching a tight zone on the wedge formation. Nevertheless, a breakout is still brewing!

Meanwhile, the technical RSI and MACD indicators are quite positive at the moment. If a wedge break-up occurs, the market might resurge to $7570 and $7900 resistance from above. For a down surge, Bitcoin could slip to $7200 and $7000 support. For now, Bitcoin is trading in a fragile zone. We might need to wait for a clear direction before initiating an entry.
- Broker
- Min Deposit
- Score
- Visit Broker
- Award-winning Cryptocurrency trading platform
- $100 minimum deposit,
- FCA & Cysec regulated
- 20% welcome bonus of upto $10,000
- Minimum deposit $100
- Verify your account before the bonus is credited
- Fund Moneta Markets account with a minimum of $250
- Opt in using the form to claim your 50% deposit bonus
Learn to Trade
Never Miss A Trade Again

Signal Notification
Real-time signal notifications whenever a signal is opened, closes or Updated

Get Alerts
Immediate alerts to your email and mobile phone.

Entry Price Levels
Entry price level for every signal Just choose one of our Top Brokers in the list above to get all this free.


