Bitcoin (BTC) Price Analysis: Daily Chart – Bearish
Key resistance levels: $9000, $9995, $10350
Key support levels: $8600, $8300, $8000
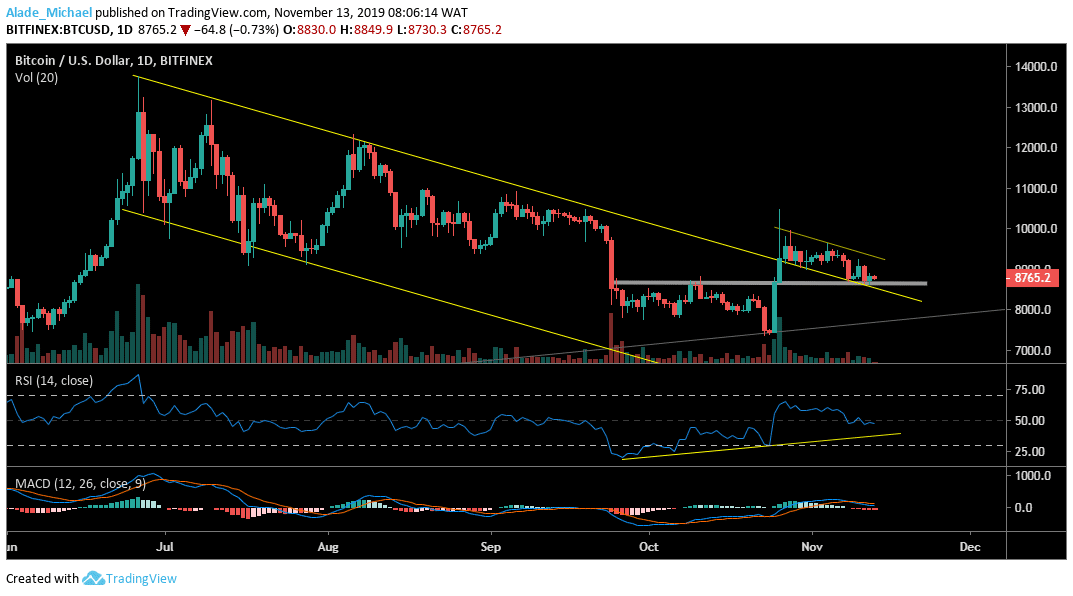
On the daily chart, Bitcoin is still sitting on the grey horizontal support at $8600 which at the same time makes the market to retest the channel’s resistance. If this support can hold well, we should expect an insane price increase in not time, although the $9000, $9995 and $10350 resistances are likely to play out.

Interestingly, the RSI has suggested a bullish divergence for a while, now looking for a level on the yellow diagonal support. Also, the MACD has signalled a crossover but appears a bit weak at the moment. Should the $8600 fail to contain bearish pressure; Bitcoin may plunge to $8300 and $8000 within a blink of an eye.
Bitcoin (BTC) Price Analysis: 4H Chart – Bearish
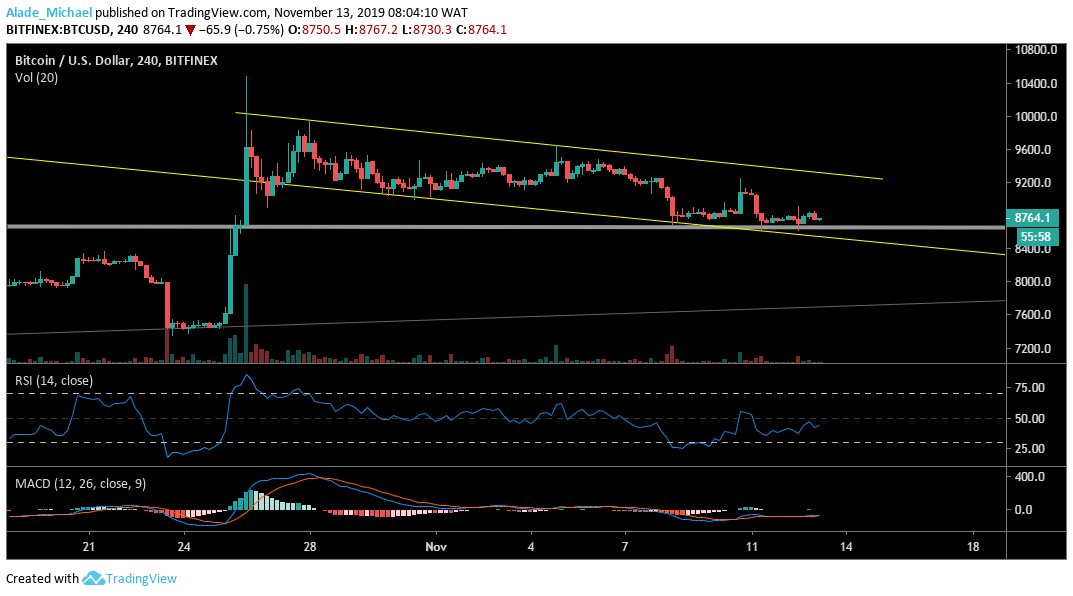
While the short-term market continues to show a sign of a bearish bias, Bitcoin is yet to find strong support for a bullish move. As appeared on the chart, BTC has extended its bearishness to $8600 over the last 24-hours of trading, following a quick price rejection at $8900. If the bearish pressure is sustained throughout this week, Bitcoin may further find a bottom at $8400, $8200 and $8000.

From all indication, the MACD revealed that the market remains under bearish control. Additionally, the RSI is showing a sign of weakness due to the recent price drop. We can expect a positive move if the buyers can regroup well. In view of that, the $9000, $9200 and $9400 resistance would be the next buying target for the bulls.
BITCOIN BUY SIGNAL
Buy Entry: $8757
TP: $8900
SL: 8570
- Broker
- Min Deposit
- Score
- Visit Broker
- Award-winning Cryptocurrency trading platform
- $100 minimum deposit,
- FCA & Cysec regulated
- 20% welcome bonus of upto $10,000
- Minimum deposit $100
- Verify your account before the bonus is credited
- Fund Moneta Markets account with a minimum of $250
- Opt in using the form to claim your 50% deposit bonus
Learn to Trade
Never Miss A Trade Again

Signal Notification
Real-time signal notifications whenever a signal is opened, closes or Updated

Get Alerts
Immediate alerts to your email and mobile phone.

Entry Price Levels
Entry price level for every signal Just choose one of our Top Brokers in the list above to get all this free.


