Bitcoin (BTC) Price Analysis: Hourly Chart – Bearish
Key resistance levels: $8300, $8500
Key support levels: $8100, $8000
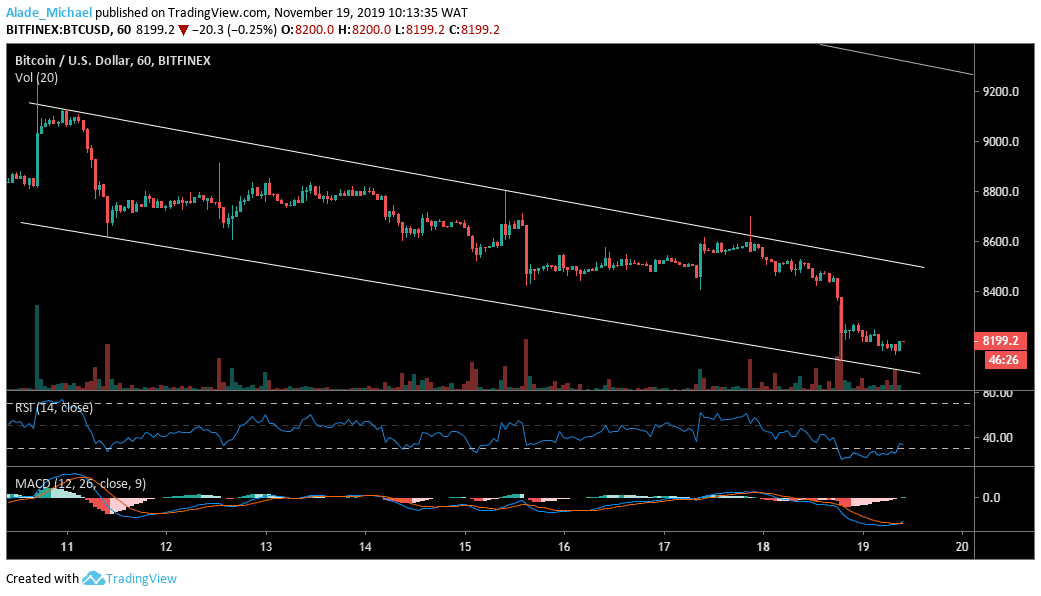
The hourly chart is keeping Bitcoin’s price in a descending channel, although the market has reached the base of the channel after yesterday’s sell-off to $8100. Bitcoin is likely to recover a bit to $8300 and $8500 resistance if the price actions obey the channel formation. Otherwise, BTC may fall out of the channel.

Taking a look at the technical RSI indicator, Bitcoin has seen a small bullish crossover, trying to leave the oversold region. More so, the MACD moving averages cross is playing out in the negative zone. This suggests that a small price recovery is likely. However, Bitcoin is still holding support at $8100 and $8000 for now.
Bitcoin (BTC) Price Analysis: 30M Chart – Bearish
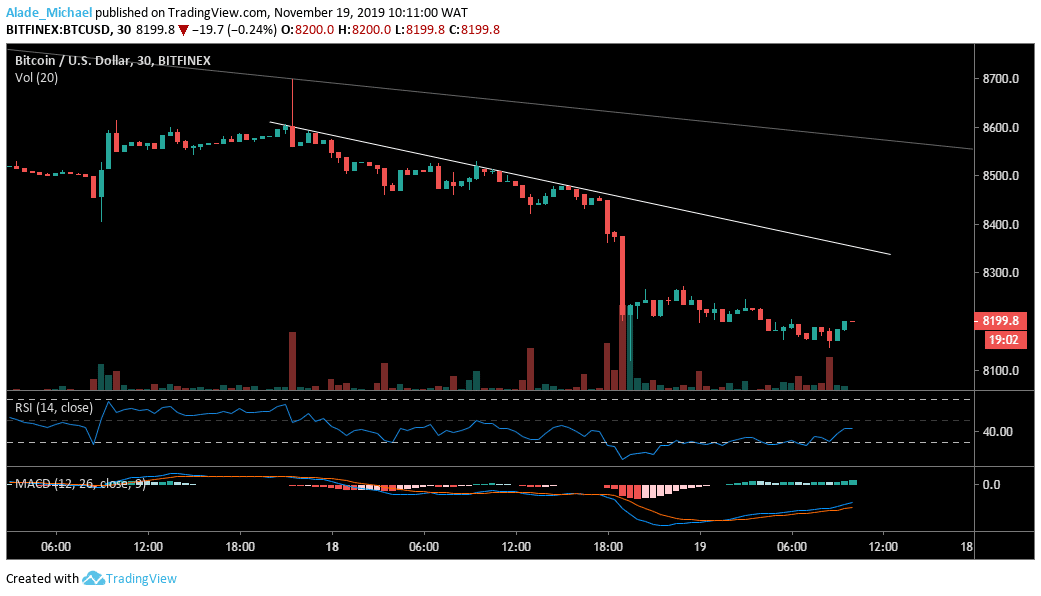
Since the market saw a sudden surge to $81000 yesterday, Bitcoin’s volatility has been contacting, suggesting a lack of interest amongst traders due to fear, uncertainty and doubt (FUD) in the market. However, a possible correction could play out to diagonal resistance at $8300 before the bears’ resume pressure on the 30-minutes chart. A further breach could also walk the bulls to $8500 resistance.

The RSI is now facing up after leaving the oversold region to reveal a potential retracement move. Similarly, the MACD is rising again, although Bitcoin is in the negative zone. If the MACD can produce a bullish crossover to confirm the RSI positive move, we can expect a strong price increase. Otherwise, bearish pressure may extend to $8100 and $8100 support in no time.
BITCOIN BUY SIGNAL
Buy Entry: $8178
TP: $8297
SL: 8035
- Broker
- Min Deposit
- Score
- Visit Broker
- Award-winning Cryptocurrency trading platform
- $100 minimum deposit,
- FCA & Cysec regulated
- 20% welcome bonus of upto $10,000
- Minimum deposit $100
- Verify your account before the bonus is credited
- Fund Moneta Markets account with a minimum of $250
- Opt in using the form to claim your 50% deposit bonus
Learn to Trade
Never Miss A Trade Again

Signal Notification
Real-time signal notifications whenever a signal is opened, closes or Updated

Get Alerts
Immediate alerts to your email and mobile phone.

Entry Price Levels
Entry price level for every signal Just choose one of our Top Brokers in the list above to get all this free.


