Bitcoin (BTC) Price Analysis: 4H Chart – Bearish
Key resistance levels: $6800, $7000
Key support levels: $6400, $6200
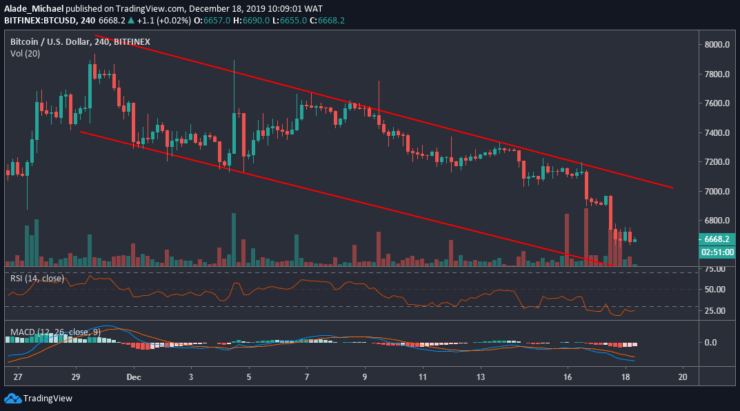
After losing the $7000 support on Monday, Bitcoin’s price has continued to look for key support levels for a bullish retracement. But looking at the formed bearish pattern on the 4-hour chart, BTC is likely to extend pressure to the lower boundary of the channel. For the next downward swing, the potential support to look out for is $6400 and $6200, although Bitcoin needs to clear $6600 support.

In case Bitcoin finds temporal support at $6600, the market could run a positive correction to $6800 and possibly $7000 resistance. But for now, there’s no sign of the bullish move. In fact, the RSI has defiantly fallen into the oversold region to indicate that sellers are getting exhausted. As shown on the MACD, the BTC/USD pair remains under the bear radar at the moment.
Bitcoin (BTC) Price Analysis: 30M Chart – Bearish
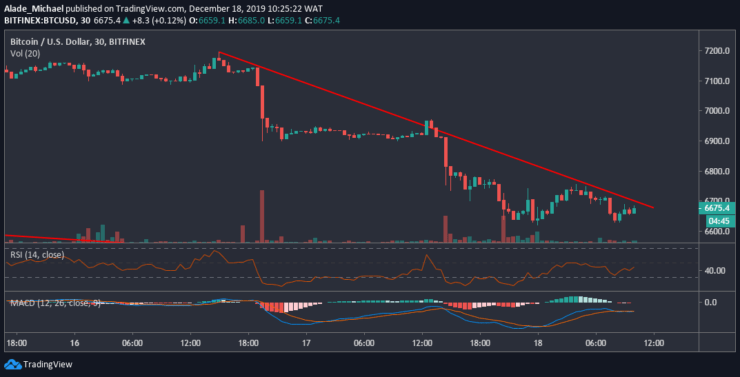
Bitcoin is forming a lower low and lower high pattern on the hourly time frame. The bearish formation shows that sellers are gaining control. Looking at the double-bottom formation at $6630, BTC may be footing an upward swing soon. However, we need to see a clean cross above the red regression line before validating a bullish move. The buyers may reclaim $6800, $6900 and $7000 resistance.

We can see that the RSI is slowly climbing back but rising above the 50 levels would confirm a long entry. The bullish pattern is also forming on the MACD, although yet to signal a positive move. However, if Bitcoin’s price meets rejection at the immediate resistance on the technical indicators; the downward swing would continue to $6500 and $6400 after breaching $6600 support. For now, BTC remains bearish on the lower time frame.
BITCOIN BUY SIGNAL
Buy Entry: $6667
TP: $6800 / $6900
SL: $6600
- Broker
- Min Deposit
- Score
- Visit Broker
- Award-winning Cryptocurrency trading platform
- $100 minimum deposit,
- FCA & Cysec regulated
- 20% welcome bonus of upto $10,000
- Minimum deposit $100
- Verify your account before the bonus is credited
- Fund Moneta Markets account with a minimum of $250
- Opt in using the form to claim your 50% deposit bonus
Learn to Trade
Never Miss A Trade Again

Signal Notification
Real-time signal notifications whenever a signal is opened, closes or Updated

Get Alerts
Immediate alerts to your email and mobile phone.

Entry Price Levels
Entry price level for every signal Just choose one of our Top Brokers in the list above to get all this free.


