Bitcoin (BTC) Price Analysis: 4H Chart – Bearish
Key resistance levels: $7600, $7755, $7890
Key support levels: $7167, $6880, $6750
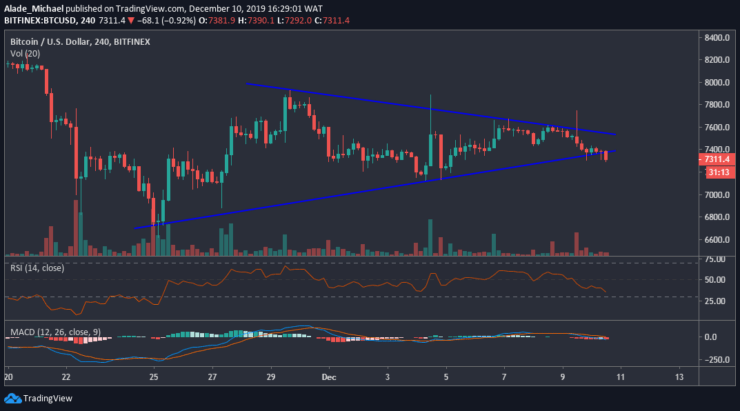
Contrary to our last crypto trading signals on Bitcoin, the price is slowly breaking below the triangle pattern on the 4-hour time frame. However, the break is not clear for now as a notable price drop is expected to occur before we can validate a strong sell.
Nonetheless, the potential supports for the bears lie at $7167, followed by $6880 and $6750. The MACD is currently attempting a crossover to the negative zones as Bitcoin’s price could witness a lot of bearish pressure.

Meanwhile, the RSI is likely to make bottom on the oversold level. If the market can hold support at the $7300 price zones, an upward trend is likely as $7600, $7755 and $7890 resistance could come into play. But as it appeared now, the BTC bears are looking for lower price levels.
Bitcoin (BTC) Price Analysis: Hourly Chart – Bearish
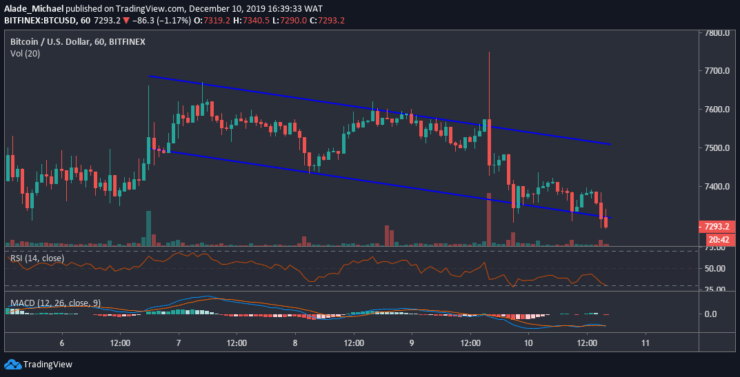
The last 24-hours price action has brought Bitcoin’s trading to the lower boundary of the channel that is forming since December 7. In fact, the market is almost breaching down the descending channel pattern. It may become significant if BTC drops to $7200 and $7100 support, or even $7000.
But as it stands now, the sellers seem to be weak at the moment. Should the buyers act upon this and manages to push the price back to $7400; Bitcoin may reclaim $7500 resistance.

Pushing the price above the falling channel could allow more buying at $7600 and $7700. But looking at the current hourly MACD, the market is under the bear radar as selling pressure could be underway. Still, Bitcoin is still relying on the RSI oversold level. At the moment, a break or a bounce is imminent for Bitcoin.
BITCOIN SELL SIGNAL
Sell Entry: $7311
TP: $7167
SL: 7409
- Broker
- Min Deposit
- Score
- Visit Broker
- Award-winning Cryptocurrency trading platform
- $100 minimum deposit,
- FCA & Cysec regulated
- 20% welcome bonus of upto $10,000
- Minimum deposit $100
- Verify your account before the bonus is credited
- Fund Moneta Markets account with a minimum of $250
- Opt in using the form to claim your 50% deposit bonus
Learn to Trade
Never Miss A Trade Again

Signal Notification
Real-time signal notifications whenever a signal is opened, closes or Updated

Get Alerts
Immediate alerts to your email and mobile phone.

Entry Price Levels
Entry price level for every signal Just choose one of our Top Brokers in the list above to get all this free.


