Bitcoin (BTC) Price Analysis: Hourly Chart – Bearish
Key resistance levels: $7300, $7400, $7500
Key support levels: $7200, $7300, $7000
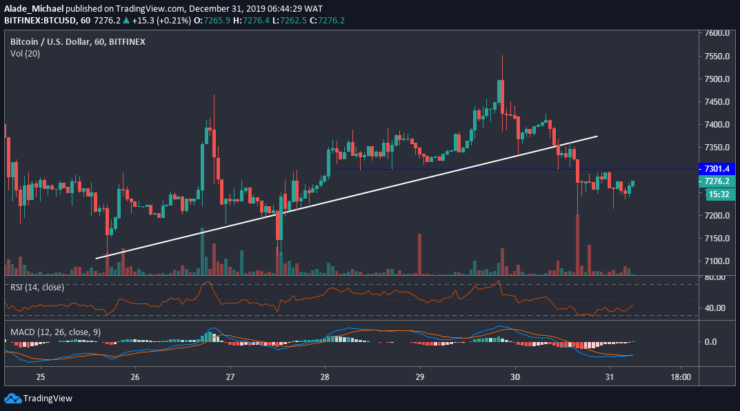
Yesterday, we mentioned the $7300 support as possible rebound level for Bitcoin but it appeared the support could not hold due to the heavy supply in the market. As we can see on the hourly chart, Bitcoin is now trading slightly below this controversial support-turned-resistance level with the current price at $7266.
Meanwhile, the $7200 was rejected twice and at the same time facing $7300 resistance. This has resulted in a small consolidation cycle over the past few hours. If Bitcoin climbs back above this resistance, the $7400 and $7500 resistance may resurface.

On the other hand, a drop below $7200 may expose $7100 support and most especially $7000 to a bearish threat. However, the technical indicators are back in their negative zones, suggesting that the sellers are returning back in the market.
Bitcoin (BTC) Price Analysis: 15M Chart – Bearish
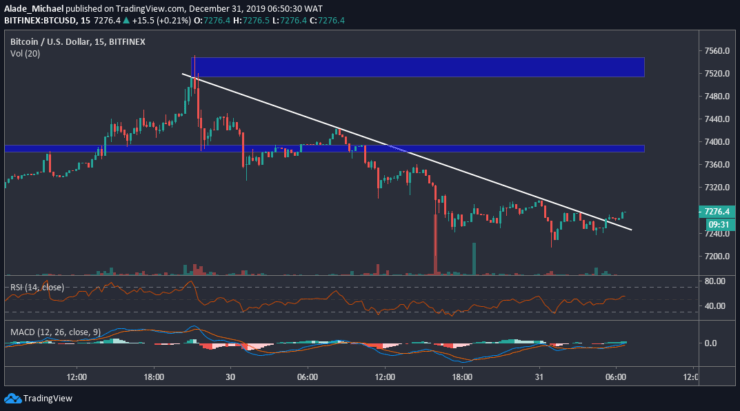
The December 29 rejection around $7500 positioned Bitcoin in a downward range on the 15-minutes time frame. But now, it seems BTC is footing another bullish swing, though the setup is not confirmed at the moment. The current break above the white regression line suggests a potential increase but the $7300 is an important resistance for the buyers to conquer.
Once this resistance breaks, BTC is likely to retest $7400 and $7500 resistance.

If the $7300 rejects, the price may roll back to $7200 and potentially $7100, which has been functioning as a key support for a while now. More so, Bitcoin is showing positive signs on the technical RSI and MACD indicators. We should expect an upswing as soon as price increases above the immediate resistance level.
BITCOIN BUY SIGNAL
Buy Entry: $7266
TP: $7377
SL: $7170
- Broker
- Min Deposit
- Score
- Visit Broker
- Award-winning Cryptocurrency trading platform
- $100 minimum deposit,
- FCA & Cysec regulated
- 20% welcome bonus of upto $10,000
- Minimum deposit $100
- Verify your account before the bonus is credited
- Fund Moneta Markets account with a minimum of $250
- Opt in using the form to claim your 50% deposit bonus
Learn to Trade
Never Miss A Trade Again

Signal Notification
Real-time signal notifications whenever a signal is opened, closes or Updated

Get Alerts
Immediate alerts to your email and mobile phone.

Entry Price Levels
Entry price level for every signal Just choose one of our Top Brokers in the list above to get all this free.


