Key Support Zones: $7, 000, $6, 000, $5,000
BTC/USD Long-term Trend: Bullish
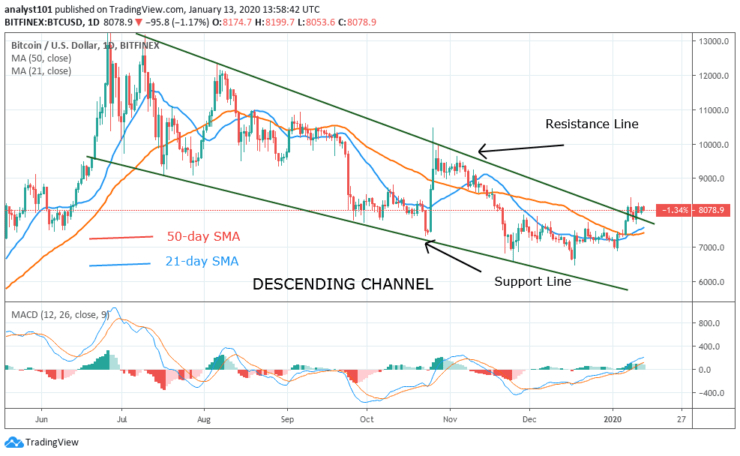
On January 10, after the bulls’ failure to break the resistance at $8,200, Bitcoin decides to fluctuate below the resistance. The coin fluctuates in a tight range of $8,000 and $8,200. The upward move has been temporarily scuttled by the bears. The price action is showing signs of a possible positive move of the coin.
For the past three days, the coin has been fluctuating in a confined range. Assuming the coin breaks out at $8,200, Bitcoin will break through the resistance and rally above $9,200. Conversely, if the bears break below $8,000, the market will fall to the low of $7,600. However, further selling will resume if the low of $7,600 cracks.
Daily Chart Indicators Reading:
Bitcoin is trading above the zero line of the daily MACD indicator. In other words, the MACD line and the MACD signal are above zero line indicating a buy signal. The exponential moving average has a bullish crossover as the 21-day SMA crosses above the 50-day SMA. This indicates that the price is rising.
BTC/USD Medium-term bias: Bullish
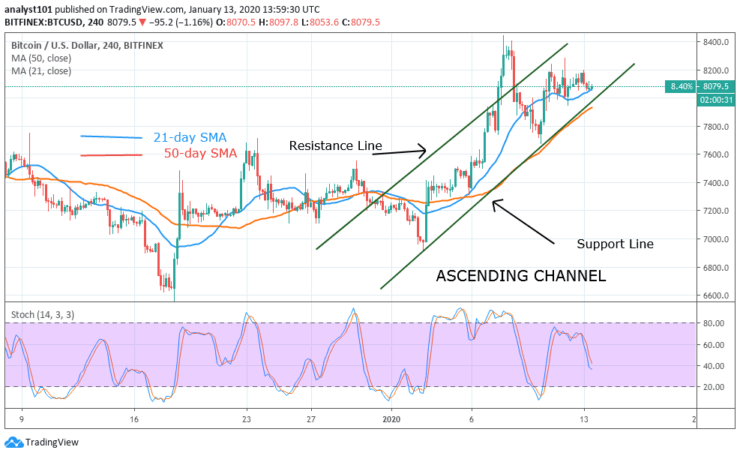
On the 4 hour chart, the coin is falling after resistance at $8,200.The price is falling to the 21-day SMA support. The fear is that Bitcoin may drop to a low of $7,600 if the selling pressure is allowed to continue. It is likely that the market will move up if the $8,000 support holds.
4-hour Chart Indicators Reading
The stochastic is indicating that the market is in bearish momentum. The price is below the 60% range of the daily stochastic. Meanwhile, the market has shown signs of bullish candlestick above the 21-day SMA support. The 21-day SMA and the 26-day SMA are pointing northward indicating that price is rising.
General Outlook for Bitcoin (BTC)
Bitcoin is currently in a sideways move as the bulls are yet to break the resistance level. In the same manner, the bears can spring a surprise and take advantage of the bulls’ inability to break the current level. The bulls and bears are in a stalemate above the $8,000 support level. On the upside, if more buyers are introduced, Bitcoin would have reached the $10, 000 mark.
BTC Trade Signal
Instrument: BTC/USD
Order: Buy
Entry price: $8,000
Stop: $7,500
Target: $10,300
- Broker
- Min Deposit
- Score
- Visit Broker

- Award-winning Cryptocurrency trading platform
- $100 minimum deposit,
- FCA & Cysec regulated

- 20% welcome bonus of upto $10,000
- Minimum deposit $100
- Verify your account before the bonus is credited
- Fund Moneta Markets account with a minimum of $250
- Opt in using the form to claim your 50% deposit bonus
Learn to Trade
Never Miss A Trade Again

Signal Notification
Real-time signal notifications whenever a signal is opened, closes or Updated

Get Alerts
Immediate alerts to your email and mobile phone.

Entry Price Levels
Entry price level for every signal Just choose one of our Top Brokers in the list above to get all this free.