Key Support Zones: $7, 000, $6, 000, $5,000
BTC/USD Long-term Trend: Ranging
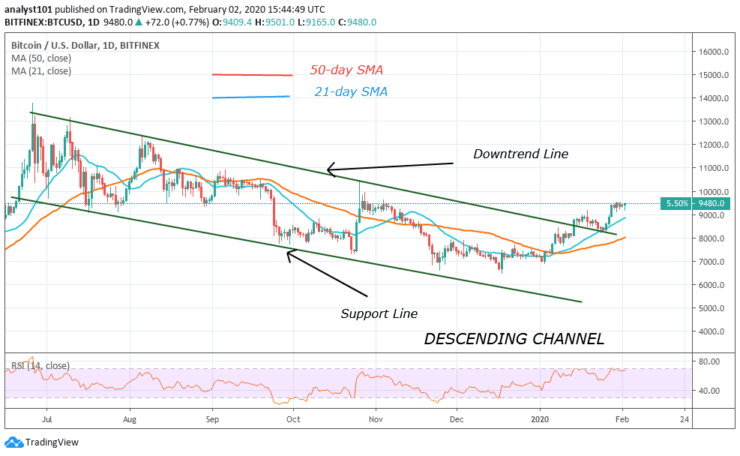
Undoubtedly, BTC has continued to range above the $9,200 support level. The bulls have successfully defended the supported level. Buyers are eagerly pushing price forward and testing to break the $9,500 resistance level. Bitcoin is fluctuating in a tight range between $9,200 and $9,500 since January 28.
The market has been characterized by small body candlestick describing the indecision between buyers and sellers about the direction of the market. As Bitcoin continues its range, there is a likelihood of a breakout or breakdown. Assuming, price breaks the $9,500 resistance, Bitcoin will rally above $10,300. Similarly, a break below $9,200 will cause the coin to drop to $8,800.
Daily Chart Indicators Reading:
Bitcoin is trading above level 67 of the daily Relative Strength Index period 14. The RSI seems to range horizontally indicating the range-bound movement. It means that the coin is in the uptrend zone. The 21-day SMA is still above the 26-day SMA indicating the rise of the coin.
BTC/USD Medium-term Trend: Bullish
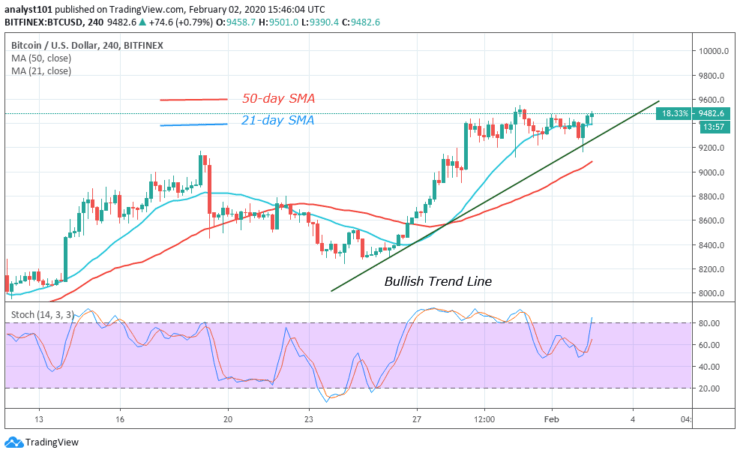
On the 4-hour chart, Bitcoin made a downward move and tested the bullish trend line. BTC is likely to bounce because it is at the support level of $9,200. If the coin bounces, it will rally above $10,300. In the previous bounce, the $8,800 resistance was broken. The market is still eager to push forward.
4-hour Chart Indicators Reading
At the moment, Bitcoin is above 60% range of the daily stochastic. The bands are sloping above the range as the range-bound movement continues. The bullish momentum is unsteady. The EMAs are trending upward
General Outlook for Bitcoin (BTC)
Bitcoin has been relatively stable above the $9,200 support level. BTC is pausing above $9,200 because the current support is respecting the historical price level. In the middle of October and early November, BTC was ranging at the same price level. Later, the price fell in line with the prevailing bearish trend.
BTC Trade Signal
Instrument: BTC/USD
Order: Buy
Entry price: $9,480
Stop: $9,000
Target: $10,300
Note: Learn2Trade.com is not a financial advisor. Do your research before investing your funds in any financial asset or presented product or event. We are not responsible for your investing results
- Broker
- Min Deposit
- Score
- Visit Broker

- Award-winning Cryptocurrency trading platform
- $100 minimum deposit,
- FCA & Cysec regulated

- 20% welcome bonus of upto $10,000
- Minimum deposit $100
- Verify your account before the bonus is credited
- Fund Moneta Markets account with a minimum of $250
- Opt in using the form to claim your 50% deposit bonus
Learn to Trade
Never Miss A Trade Again

Signal Notification
Real-time signal notifications whenever a signal is opened, closes or Updated

Get Alerts
Immediate alerts to your email and mobile phone.

Entry Price Levels
Entry price level for every signal Just choose one of our Top Brokers in the list above to get all this free.