BNBUSD Price Analysis – December 03
In case the resistance level of $678 is penetrated upside, the price may soar to $758 which may extend to $850. Should the resistance level of $678 is defended by the bears, the price may reverse and continue a bearish movement towards the support levels of $599, $540 and $503.
BNB/USD Market
Key levels:
Supply levels: $678, $758, $850
Demand levels: $599, $540, $503
BNBUSD Long-term Trend: Bullish
On the long-term outlook, BNBUSD is bullish. The coin fell to the support level of $540 after the formation of double top chart pattern. The bearish momentum is interrupted by the bull with formation of a bullish engulfing candle at the support level of $540. Binance Coin is increasing at the moment and the $599 level has been penetrated upside. Last week price momentum is low and the price remains within $678 and $599 levels.
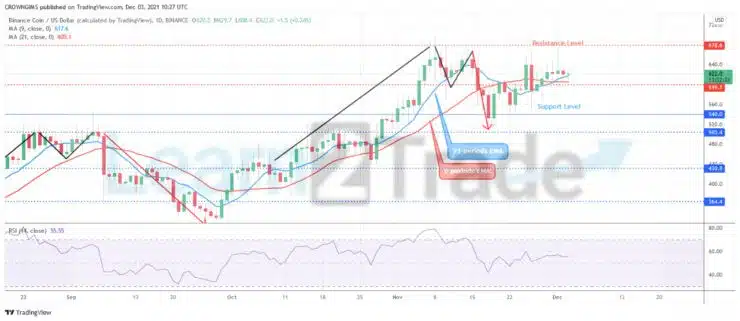
The Binance Coin is trading above the two EMAs at close distance which indicate that bullish momentum is low in the Binance market. The fast moving EMA (9 periods) has crossed the slow moving EMA (21 periods) upside. In case the resistance level of $678 is penetrated upside, the price may soar to $758 which may extend to $850. Should the resistance level of $678 is defended by the bears, the price may reverse and continue a bearish movement towards the support levels of $599, $540 and $503.
BNBUSD medium-term Trend: Bullish
Binance coin is on the bullish movement on the 4 hour chart. The Binance market experienced a bearish momentum when there was a double top chart pattern at the resistance level of $678. The downtrend movement could not continue as the bears’ pressure failed at $540 price level. Bullish engulfing candle formed and the price increases towards the resistance level of $678.

The Binance Coin is trading around the 9 periods EMA and 21 periods EMA which indicate that buyers’ momentum is low in the Binance market.
You can purchase crypto coins here. Buy Tokens